
Page 69 - Numerical Analysis and Modelling in Geomechanics
P. 69
50 A.A.JAVADI
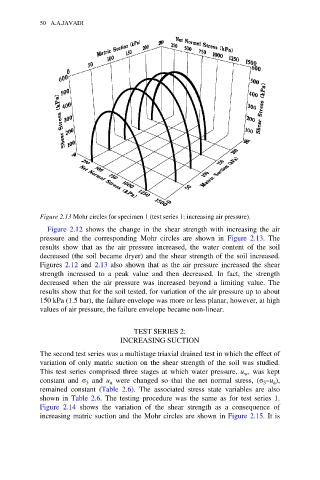
Figure 2.13 Mohr circles for specimen 1 (test series 1: increasing air pressure).
Figure 2.12 shows the change in the shear strength with increasing the air
pressure and the corresponding Mohr circles are shown in Figure 2.13. The
results show that as the air pressure increased, the water content of the soil
decreased (the soil became dryer) and the shear strength of the soil increased.
Figures 2.12 and 2.13 also shown that as the air pressure increased the shear
strength increased to a peak value and then decreased. In fact, the strength
decreased when the air pressure was increased beyond a limiting value. The
results show that for the soil tested, for variation of the air pressure up to about
150 kPa (1.5 bar), the failure envelope was more or less planar, however, at high
values of air pressure, the failure envelope became non-linear.
TEST SERIES 2:
INCREASING SUCTION
The second test series was a multistage triaxial drained test in which the effect of
variation of only matric suction on the shear strength of the soil was studied.
This test series comprised three stages at which water pressure, u , was kept
w
constant and σ 3 and u a were changed so that the net normal stress, (σ –u ),
3
a
remained constant (Table 2.6). The associated stress state variables are also
shown in Table 2.6. The testing procedure was the same as for test series 1.
Figure 2.14 shows the variation of the shear strength as a consequence of
increasing matric suction and the Mohr circles are shown in Figure 2.15. It is