
Page 72 - Numerical Analysis and Modelling in Geomechanics
P. 72
COMPRESSED AIR TUNNELLING 53
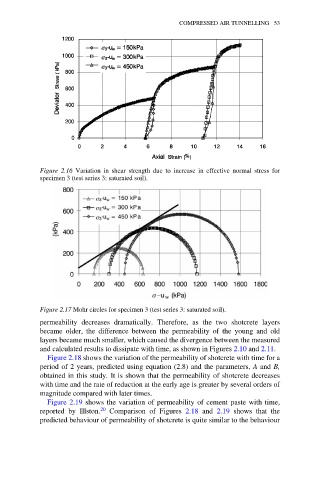
Figure 2.16 Variation in shear strength due to increase in effective normal stress for
specimen 3 (test series 3: saturated soil).
Figure 2.17 Mohr circles for specimen 3 (test series 3: saturated soil).
permeability decreases dramatically. Therefore, as the two shotcrete layers
became older, the difference between the permeability of the young and old
layers became much smaller, which caused the divergence between the measured
and calculated results to dissipate with time, as shown in Figures 2.10 and 2.11.
Figure 2.18 shows the variation of the permeability of shotcrete with time for a
period of 2 years, predicted using equation (2.8) and the parameters, A and B,
obtained in this study. It is shown that the permeability of shotcrete decreases
with time and the rate of reduction at the early age is greater by several orders of
magnitude compared with later times.
Figure 2.19 shows the variation of permeability of cement paste with time,
reported by Illston. 20 Comparison of Figures 2.18 and 2.19 shows that the
predicted behaviour of permeability of shotcrete is quite similar to the behaviour