
Page 89 - Numerical Analysis and Modelling in Geomechanics
P. 89
70 D.S.JENG
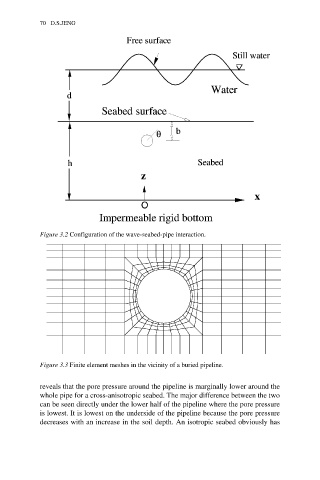
Figure 3.2 Configuration of the wave-seabed-pipe interaction.
Figure 3.3 Finite element meshes in the vicinity of a buried pipeline.
reveals that the pore pressure around the pipeline is marginally lower around the
whole pipe for a cross-anisotropic seabed. The major difference between the two
can be seen directly under the lower half of the pipeline where the pore pressure
is lowest. It is lowest on the underside of the pipeline because the pore pressure
decreases with an increase in the soil depth. An isotropic seabed obviously has