
Page 375 - Numerical Methods for Chemical Engineering
P. 375
364 7 Probability theory and stochastic simulation
1 1
1
1 −1
vav e
1 −2
est
1 −
1 −
1 −
2 1
ener atin
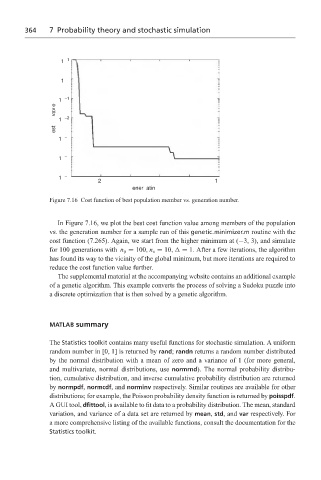
Figure 7.16 Cost function of best population member vs. generation number.
In Figure 7.16, we plot the best cost function value among members of the population
vs. the generation number for a sample run of this genetic minimizer.m routine with the
cost function (7.265). Again, we start from the higher minimum at (−3, 3), and simulate
for 100 generations with n p = 100, n s = 10, = 1. After a few iterations, the algorithm
has found its way to the vicinity of the global minimum, but more iterations are required to
reduce the cost function value further.
The supplemental material at the accompanying website contains an additional example
of a genetic algorithm. This example converts the process of solving a Sudoku puzzle into
a discrete optimization that is then solved by a genetic algorithm.
MATLAB summary
The Statistics toolkit contains many useful functions for stochastic simulation. A uniform
random number in [0, 1] is returned by rand; randn returns a random number distributed
by the normal distribution with a mean of zero and a variance of 1 (for more general,
and multivariate, normal distributions, use normrnd). The normal probability distribu-
tion, cumulative distribution, and inverse cumulative probability distribution are returned
by normpdf, normcdf, and norminv respectively. Similar routines are available for other
distributions; for example, the Poisson probability density function is returned by poisspdf.
A GUI tool, dfittool, is available to fit data to a probability distribution. The mean, standard
variation, and variance of a data set are returned by mean, std, and var respectively. For
a more comprehensive listing of the available functions, consult the documentation for the
Statistics toolkit.