
Page 106 - Optical Switching And Networking Handbook
P. 106
05_200023_CH04/Batesx 1/17/01 8:18 AM Page 91
Synchronous Digital Hierarchy 91
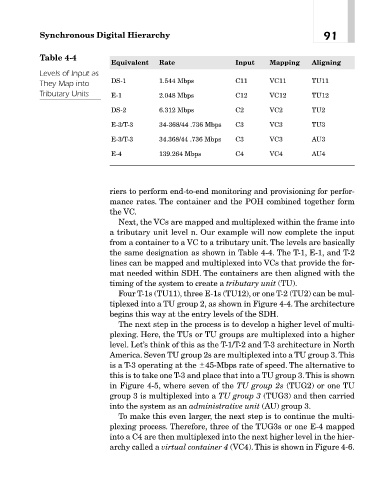
Table 4-4
Equivalent Rate Input Mapping Aligning
Levels of Input as
DS-1 1.544 Mbps C11 VC11 TU11
They Map into
Tributary Units E-1 2.048 Mbps C12 VC12 TU12
DS-2 6.312 Mbps C2 VC2 TU2
E-3/T-3 34-368/44 .736 Mbps C3 VC3 TU3
E-3/T-3 34.368/44 .736 Mbps C3 VC3 AU3
E-4 139.264 Mbps C4 VC4 AU4
riers to perform end-to-end monitoring and provisioning for perfor-
mance rates. The container and the POH combined together form
the VC.
Next, the VCs are mapped and multiplexed within the frame into
a tributary unit level n. Our example will now complete the input
from a container to a VC to a tributary unit. The levels are basically
the same designation as shown in Table 4-4. The T-1, E-1, and T-2
lines can be mapped and multiplexed into VCs that provide the for-
mat needed within SDH. The containers are then aligned with the
timing of the system to create a tributary unit (TU).
Four T-1s (TU11), three E-1s (TU12), or one T-2 (TU2) can be mul-
tiplexed into a TU group 2, as shown in Figure 4-4. The architecture
begins this way at the entry levels of the SDH.
The next step in the process is to develop a higher level of multi-
plexing. Here, the TUs or TU groups are multiplexed into a higher
level. Let’s think of this as the T-1/T-2 and T-3 architecture in North
America. Seven TU group 2s are multiplexed into a TU group 3.This
is a T-3 operating at the 45-Mbps rate of speed. The alternative to
this is to take one T-3 and place that into a TU group 3.This is shown
in Figure 4-5, where seven of the TU group 2s (TUG2) or one TU
group 3 is multiplexed into a TU group 3 (TUG3) and then carried
into the system as an administrative unit (AU) group 3.
To make this even larger, the next step is to continue the multi-
plexing process. Therefore, three of the TUG3s or one E-4 mapped
into a C4 are then multiplexed into the next higher level in the hier-
archy called a virtual container 4 (VC4). This is shown in Figure 4-6.