
Page 90 - Optofluidics Fundamentals, Devices, and Applications
P. 90
Optofluidic Optical Components 71
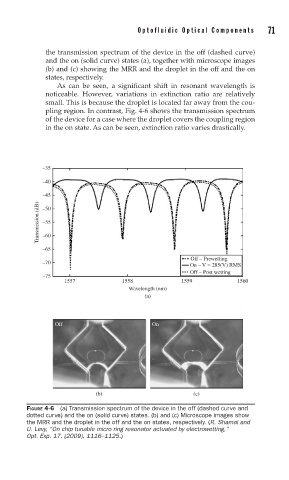
the transmission spectrum of the device in the off (dashed curve)
and the on (solid curve) states (a), together with microscope images
(b) and (c) showing the MRR and the droplet in the off and the on
states, respectively.
As can be seen, a significant shift in resonant wavelength is
noticeable. However, variations in extinction ratio are relatively
small. This is because the droplet is located far away from the cou-
pling region. In contrast, Fig. 4-6 shows the transmission spectrum
of the device for a case where the droplet covers the coupling region
in the on state. As can be seen, extinction ratio varies drastically.
–35
–40
–45
Transmission (dB) –55
–50
–60
–65
Off – Prewetting
–70
On – V = 285(V) RMS
Off – Post wetting
–75
1557 1558 1559 1560
Wavelength (nm)
(a)
Off On
(b) (c)
FIGURE 4-6 (a) Transmission spectrum of the device in the off (dashed curve and
dotted curve) and the on (solid curve) states. (b) and (c) Microscope images show
the MRR and the droplet in the off and the on states, respectively. (R. Shamai and
U. Levy, “On chip tunable micro ring resonator actuated by electrowetting,”
Opt. Exp. 17, (2009), 1116–1125.)