
Page 202 - Organic Electronics in Sensors and Biotechnology
P. 202
Progress and Challenges in OLED-Based Chemical and Biological Sensors 179
and all the analyte is oxidized, then
[DO] = [DO] – [analyte] (5.4)
fi nal initial initial
This leads to the modified SV relation
I /I =τ /τ= 1 + K × ([DO] – [analyte] ) (5.5)
0 0 SV initial initial
Therefore, 1/τ vs. [analyte] will ideally be linear with a slope
initial
equal to –K , which, as expected, was found to be film-dependent.
SV
Equation (5.5) is also valid for containers open to air, if the oxidation
of the analyte [Eq. (5.2)] is much faster than the rate at which gas-
phase oxygen diffuses into the solution.
64
The results shown below and published elsewhere were in excel-
lent agreement with Eq. (5.5). And although that equation appears to
limit the dynamic range to [DO] ~ 8.6 wt ppm ~ 0.25 mM in equi-
initial
librium with air at 23°C, it is only the dynamic range in the final test
solution, which may be diluted. Thus, through dilution, the actual
dynamic range is wider and covers the concentration range of the
various applications.
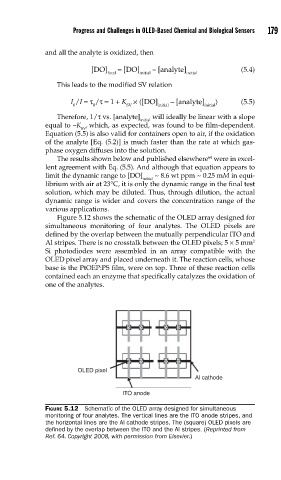
Figure 5.12 shows the schematic of the OLED array designed for
simultaneous monitoring of four analytes. The OLED pixels are
defined by the overlap between the mutually perpendicular ITO and
Al stripes. There is no crosstalk between the OLED pixels; 5 × 5 mm 2
Si photodiodes were assembled in an array compatible with the
OLED pixel array and placed underneath it. The reaction cells, whose
base is the PtOEP:PS film, were on top. Three of these reaction cells
contained each an enzyme that specifically catalyzes the oxidation of
one of the analytes.
OLED pixel
Al cathode
ITO anode
FIGURE 5.12 Schematic of the OLED array designed for simultaneous
monitoring of four analytes. The vertical lines are the ITO anode stripes, and
the horizontal lines are the Al cathode stripes. The (square) OLED pixels are
defi ned by the overlap between the ITO and the Al stripes. (Reprinted from
Ref. 64. Copyright 2008, with permission from Elsevier.)