
Page 197 - Organic Electronics in Sensors and Biotechnology
P. 197
174 Chapter Five
4
100% Ar 4
O -saturated water
2
3 3 2
PL intensity (arb. units) 2 PL intensity (arb. units) 1
0
1
20
10
Time (μs) 30
0
0 2000 4000 6000
Time (μs)
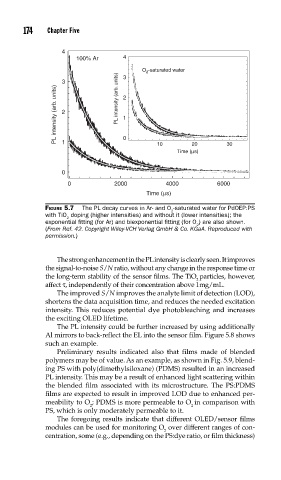
FIGURE 5.7 The PL decay curves in Ar- and O -saturated water for PdOEP:PS
2
with TiO doping (higher intensities) and without it (lower intensities); the
2
exponential fi tting (for Ar) and biexponential fi tting (for O ) are also shown.
2
(From Ref. 42. Copyright Wiley-VCH Verlag GmbH & Co. KGaA. Reproduced with
permission.)
The strong enhancement in the PL intensity is clearly seen. It improves
the signal-to-noise S/N ratio, without any change in the response time or
the long-term stability of the sensor films. The TiO particles, however,
2
affect τ, independently of their concentration above 1mg/mL.
The improved S/N improves the analyte limit of detection (LOD),
shortens the data acquisition time, and reduces the needed excitation
intensity. This reduces potential dye photobleaching and increases
the exciting OLED lifetime.
The PL intensity could be further increased by using additionally
Al mirrors to back-reflect the EL into the sensor film. Figure 5.8 shows
such an example.
Preliminary results indicated also that films made of blended
polymers may be of value. As an example, as shown in Fig. 5.9, blend-
ing PS with poly(dimethylsiloxane) (PDMS) resulted in an increased
PL intensity. This may be a result of enhanced light scattering within
the blended film associated with its microstructure. The PS:PDMS
films are expected to result in improved LOD due to enhanced per-
meability to O ; PDMS is more permeable to O in comparison with
2 2
PS, which is only moderately permeable to it.
The foregoing results indicate that different OLED/sensor films
modules can be used for monitoring O over different ranges of con-
2
centration, some (e.g., depending on the PS:dye ratio, or film thickness)