
Page 196 - Organic Electronics in Sensors and Biotechnology
P. 196
Progress and Challenges in OLED-Based Chemical and Biological Sensors 173
The results indicated that the overall accuracy was generally ±0.5%.
Over a testing period of 30 days, τ measured in air using the Alq /
3
PtOEP:PS module gradually decreased from 20.2 ± 0.1 to 19.7 ± 0.05 μs.
Hence, the relative error decreased from ~0.5 to ~0.25% over this
period. These measurements, and others, demonstrated that these
sensor module lifetimes are well over 30 days.
The results shown in Fig. 5.5 are for a film doped with PdOEP
42
and 360 nm diameter titania (TiO ) particles. Such doping enhances
2
the PL of the O sensing films. When excited by an OLED, the dye PL
2
intensity increases up to ~10-fold, depending on the TiO concentra-
2
tion and the excitation source. The enhanced PL is attributed to light
scattering by the embedded TiO particles, due to their high n ~ 2.8
2
index of refraction relative to that of the polymer matrix (n ~ 1.5), and
possibly by voids in the film, whose n = 1 is much lower than that of
the matrix. The particles and voids scatter the EL, increasing its opti-
cal path and consequently its absorption and the PL. The particles can
also result in an increase in the PL outcoupling, reducing waveguid-
ing to the film edges.
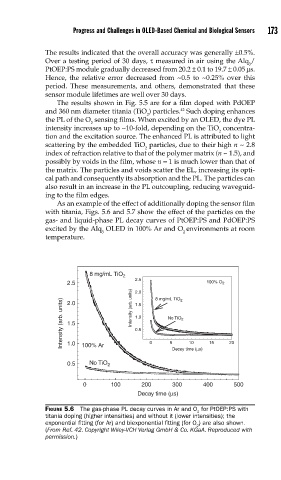
As an example of the effect of additionally doping the sensor film
with titania, Figs. 5.6 and 5.7 show the effect of the particles on the
gas- and liquid-phase PL decay curves of PtOEP:PS and PdOEP:PS
excited by the Alq OLED in 100% Ar and O environments at room
3 2
temperature.
8 mg/mL TiO 2
2.5
2.5 2.0 8 mg/mL TiO 2 100% O 2
Intensity (arb. units) 2.0 Intensity (arb. units) 1.5 0 No TiO 2 10 15 20
1.0
1.5
0.5
1.0
5
No TiO
0.5 100% Ar 2 Decay time (μs)
0 100 200 300 400 500
Decay time (μs)
FIGURE 5.6 The gas-phase PL decay curves in Ar and O for PtOEP:PS with
2
titania doping (higher intensities) and without it (lower intensities); the
exponential fi tting (for Ar) and biexponential fi tting (for O ) are also shown.
2
(From Ref. 42. Copyright Wiley-VCH Verlag GmbH & Co. KGaA. Reproduced with
permission.)