
Page 194 - Organic Electronics in Sensors and Biotechnology
P. 194
Progress and Challenges in OLED-Based Chemical and Biological Sensors 171
14
12
10
8
τ 0 /τ
6
4
2
0
0 10 20 30 40
DO concentration (wt. ppm)
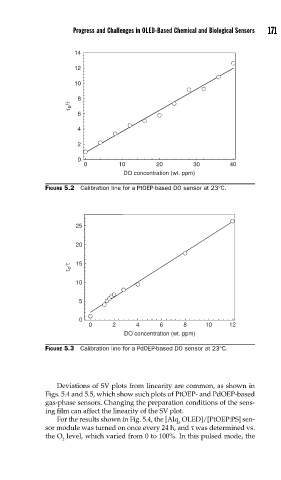
FIGURE 5.2 Calibration line for a PtOEP-based DO sensor at 23°C.
25
20
τ 0 /τ 15
10
5
0
0 2 4 6 8 10 12
DO concentration (wt. ppm)
FIGURE 5.3 Calibration line for a PdOEP-based DO sensor at 23°C.
Deviations of SV plots from linearity are common, as shown in
Figs. 5.4 and 5.5, which show such plots of PtOEP- and PdOEP-based
gas-phase sensors. Changing the preparation conditions of the sens-
ing film can affect the linearity of the SV plot.
For the results shown in Fig. 5.4, the [Alq OLED]/[PtOEP:PS] sen-
3
sor module was turned on once every 24 h, and τ was determined vs.
the O level, which varied from 0 to 100%. In this pulsed mode, the
2