Page 195 - Organic Electronics in Sensors and Biotechnology
P. 195

172    Chapter  Five


                        40
                                Day 1
                                Day 30
                        30


                      τ 0 /τ  20


                        10


                         0
                          0       20      40      60      80     100
                                             % O 2

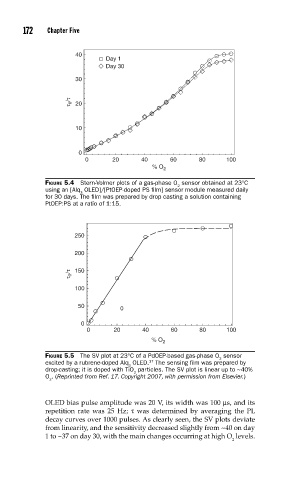
               FIGURE 5.4  Stern-Volmer plots of a gas-phase O  sensor obtained at 23°C
                                                    2
               using an [Alq  OLED]/[PtOEP-doped PS fi lm] sensor module measured daily
                         3
               for 30 days. The fi lm was prepared by drop casting a solution containing
               PtOEP:PS at a ratio of 1:15.


                       250

                       200

                      τ 0 /τ  150

                       100

                        50          0

                         0
                           0      20      40      60      80     100
                                             % O 2
               FIGURE 5.5  The SV plot at 23°C of a PdOEP-based gas-phase O  sensor
                                                               2
                                            17
               excited by a rubrene-doped Alq  OLED.  The sensing fi lm was prepared by
                                      3
               drop-casting; it is doped with TiO  particles. The SV plot is linear up to ~40%
                                        2
               O . (Reprinted from Ref. 17. Copyright 2007, with permission from Elsevier.)
                 2
               OLED bias pulse amplitude was 20 V, its width was 100 μs, and its
               repetition rate was 25 Hz;  τ was determined by averaging the PL
               decay curves over 1000 pulses. As clearly seen, the SV plots deviate
               from linearity, and the sensitivity decreased slightly from ~40 on day
               1 to ~37 on day 30, with the main changes occurring at high O  levels.
                                                                   2
   190   191   192   193   194   195   196   197   198   199   200