
Page 203 - Organic Electronics in Sensors and Biotechnology
P. 203
180 Chapter Five
35
Ethanol
Glucose
30 Lactate
1/τ (ms –1 ) 25
20
15
10
0.00 0.05 0.10 0.15 0.20 0.25 0.30
Analyte concentration (mM)
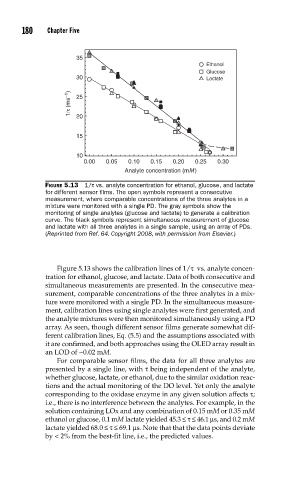
FIGURE 5.13 1/τ vs. analyte concentration for ethanol, glucose, and lactate
for different sensor fi lms. The open symbols represent a consecutive
measurement, where comparable concentrations of the three analytes in a
mixture were monitored with a single PD. The gray symbols show the
monitoring of single analytes (glucose and lactate) to generate a calibration
curve. The black symbols represent simultaneous measurement of glucose
and lactate with all three analytes in a single sample, using an array of PDs.
(Reprinted from Ref. 64. Copyright 2008, with permission from Elsevier.)
Figure 5.13 shows the calibration lines of 1/τ vs. analyte concen-
tration for ethanol, glucose, and lactate. Data of both consecutive and
simultaneous measurements are presented. In the consecutive mea-
surement, comparable concentrations of the three analytes in a mix-
ture were monitored with a single PD. In the simultaneous measure-
ment, calibration lines using single analytes were first generated, and
the analyte mixtures were then monitored simultaneously using a PD
array. As seen, though different sensor films generate somewhat dif-
ferent calibration lines, Eq. (5.5) and the assumptions associated with
it are confirmed, and both approaches using the OLED array result in
an LOD of ~0.02 mM.
For comparable sensor films, the data for all three analytes are
presented by a single line, with τ being independent of the analyte,
whether glucose, lactate, or ethanol, due to the similar oxidation reac-
tions and the actual monitoring of the DO level. Yet only the analyte
corresponding to the oxidase enzyme in any given solution affects τ;
i.e., there is no interference between the analytes. For example, in the
solution containing LOx and any combination of 0.15 mM or 0.35 mM
ethanol or glucose, 0.1 mM lactate yielded 45.3 ≤τ≤ 46.1 μs, and 0.2 mM
lactate yielded 68.0 ≤τ≤ 69.1 μs. Note that that the data points deviate
by < 2% from the best-fit line, i.e., the predicted values.