
Page 172 - Origin and Prediction of Abnormal Formation Pressures
P. 172
METHODS OF ESTIMATING AND PREDICTING ABNORMAL FORMATION PRESSURES 147
IES 1964 NLL 1967 NLL 1968
40 30 20 40 30 20
I | i i , J
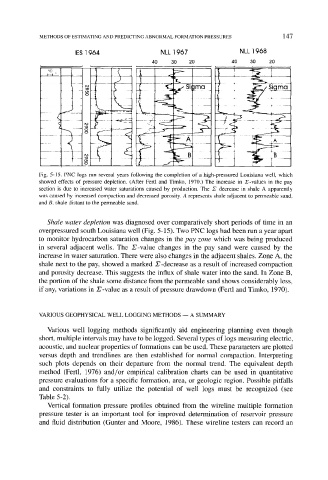
Fig. 5-15. PNC logs run several years following the completion of a high-pressured Louisiana well, which
showed effects of pressure depletion. (After Fertl and Timko, 1970.) The increase in E-values in the pay
section is due to increased water saturations caused by production. The 2S decrease in shale A apparently
was caused by increased compaction and decreased porosity. A represents shale adjacent to permeable sand,
and B, shale distant to the permeable sand.
Shale water depletion was diagnosed over comparatively short periods of time in an
overpressured south Louisiana well (Fig. 5-15). Two PNC logs had been run a year apart
to monitor hydrocarbon saturation changes in the pay zone which was being produced
in several adjacent wells. The r-value changes in the pay sand were caused by the
increase in water saturation. There were also changes in the adjacent shales. Zone A, the
shale next to the pay, showed a marked Z-decrease as a result of increased compaction
and porosity decrease. This suggests the influx of shale water into the sand. In Zone B,
the portion of the shale some distance from the permeable sand shows considerably less,
if any, variations in S-value as a result of pressure drawdown (Fertl and Timko, 1970).
VARIOUS GEOPHYSICAL WELL LOGGING METHODS -- A SUMMARY
Various well logging methods significantly aid engineering planning even though
short, multiple intervals may have to be logged. Several types of logs measuring electric,
acoustic, and nuclear properties of formations can be used. These parameters are plotted
versus depth and trendlines are then established for normal compaction. Interpreting
such plots depends on their departure from the normal trend. The equivalent depth
method (Fertl, 1976) and/or empirical calibration charts can be used in quantitative
pressure evaluations for a specific formation, area, or geologic region. Possible pitfalls
and constraints to fully utilize the potential of well logs must be recognized (see
Table 5-2).
Vertical formation pressure profiles obtained from the wireline multiple formation
pressure tester is an important tool for improved determination of reservoir pressure
and fluid distribution (Gunter and Moore, 1986). These wireline testers can record an