
Page 171 - Origin and Prediction of Abnormal Formation Pressures
P. 171
146 G.V. CHILINGAR, V.A. SEREBRYAKOV, S.A. KATZ AND J.O. ROBERTSON JR.
DE ql- ............................. B
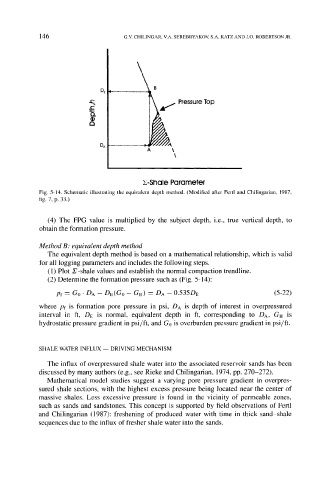
i ~ Pressure Top
c-
O.
a
DA
A
E-Shale Parameter
Fig. 5-14. Schematic illustrating the equivalent depth method. (Modified after Fertl and Chilingarian, 1987,
fig. 7, p. 33.)
(4) The FPG value is multiplied by the subject depth, i.e., true vertical depth, to
obtain the formation pressure.
Method B: equivalent depth method
The equivalent depth method is based on a mathematical relationship, which is valid
for all logging parameters and includes the following steps.
(1) Plot S-shale values and establish the normal compaction trendline.
(2) Determine the formation pressure such as (Fig. 5-14):
pf- Go. DA -- DE(Go- GH) -- DA --0.535DE (5-22)
where pt is formation pore pressure in psi, DA is depth of interest in overpressured
interval in ft, DE is normal, equivalent depth in ft, corresponding to DA, GIj is
hydrostatic pressure gradient in psi/ft, and G0 is overburden pressure gradient in psi/ft.
SHALE WATER INFLUX- DRIVING MECHANISM
The influx of overpressured shale water into the associated reservoir sands has been
discussed by many authors (e.g., see Rieke and Chilingarian, 1974, pp. 270-272).
Mathematical model studies suggest a varying pore pressure gradient in overpres-
sured shale sections, with the highest excess pressure being located near the center of
massive shales. Less excessive pressure is found in the vicinity of permeable zones,
such as sands and sandstones. This concept is supported by field observations of Fertl
and Chilingarian (1987): freshening of produced water with time in thick sand-shale
sequences due to the influx of fresher shale water into the sands.