
Page 170 - Origin and Prediction of Abnormal Formation Pressures
P. 170
METHODS OF ESTIMATING AND PREDICTING ABNORMAL FORMATION PRESSURES ] 45
I 9
I
I / 2 /
D /
E I
0 I
t-. / /
o I
/ J
/
D , /
0 /
0 /
.Q "1- ~ I /" /
._
o
~- ~ 9 /
r .......
0 z I ,~.~ /..,
,.,...
D I
J //, . / 9
!
r,,q
I
I "/
I/I
GH GO
"~ Formation FPG, psi/ft
Equivalent Mud Weight, Ib/gal
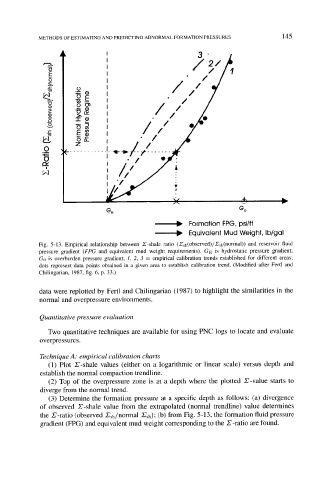
Fig. 5-13. Empirical relationship between ZT-shale ratio (Esh(observed)/Xsh(normal)) and reservoir fluid
pressure gradient (FPG and equivalent mud weight requirements). GH is hydrostatic pressure gradient;
Go is overburden pressure gradient; 1, 2, 3 -- empirical calibration trends established for different areas;
dots represent data points obtained in a given area to establish calibration trend. (Modified after Fertl and
Chilingarian, 1987, fig. 6, p. 33.)
data were replotted by Fertl and Chilingarian (1987) to highlight the similarities in the
normal and overpressure environments.
Quantitative pressure evaluation
Two quantitative techniques are available for using PNC logs to locate and evaluate
overpressures.
Technique A: empirical calibration charts
(1) Plot r-shale values (either on a logarithmic or linear scale) versus depth and
establish the normal compaction trendline.
(2) Top of the overpressure zone is at a depth where the plotted r-value starts to
diverge from the normal trend.
(3) Determine the formation pressure at a specific depth as follows: (a) divergence
of observed ,V-shale value from the extrapolated (normal trendline) value determines
the ~7-ratio (observed Xsh/normal ZTsh); (b) from Fig. 5-13, the formation fluid pressure
gradient (FPG) and equivalent mud weight corresponding to the E-ratio are found.