
Page 165 - Origin and Prediction of Abnormal Formation Pressures
P. 165
METHODS OF ESTIMATING AND PREDICTING ABNORMAL FORMATION PRESSURES 141
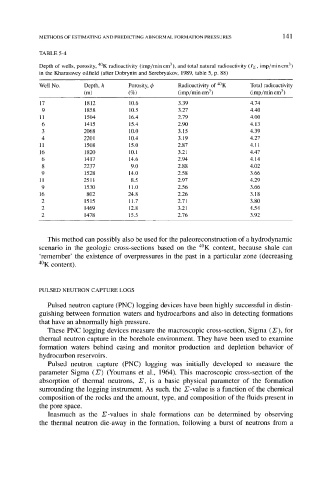
TABLE 5-4
Depth of wells, porosity, 4~ radioactivity (imp/min cm3), and total natural radioactivity (Iz, imp/min cm 3)
in the Kharasavey oilfield (after Dobrynin and Serebryakov, 1989, table 5, p. 88)
Well No. Depth, h Porosity, 4~ Radioactivity of 4~ Total radioactivity
(m) (%) (imp/min cm 3 ) (imp/min cm 3 )
17 1812 10.6 3.39 4.74
9 1858 10.5 3.27 4.40
11 1504 16.4 2.79 4.00
6 1415 15.4 2.90 4.13
3 2068 10.0 3.15 4.39
4 2201 10.4 3.19 4.27
11 1508 15.0 2.87 4.11
16 1820 10.1 3.21 4.47
6 1417 14.6 2.94 4.14
8 2237 9.0 2.88 4.02
9 1528 14.0 2.58 3.66
11 2511 8.5 2.97 4.29
9 1530 11.0 2.56 3.66
16 802 24.8 2.26 3.18
2 1515 11.7 2.71 3.80
2 1469 12.8 3.21 4.54
2 1478 15.5 2.76 3.92
This method can possibly also be used for the paleoreconstruction of a hydrodynamic
scenario in the geologic cross-sections based on the 4~ content, because shale can
'remember' the existence of overpressures in the past in a particular zone (decreasing
4~ content).
PULSED NEUTRON CAPTURE LOGS
Pulsed neutron capture (PNC) logging devices have been highly successful in distin-
guishing between formation waters and hydrocarbons and also in detecting formations
that have an abnormally high pressure.
These PNC logging devices measure the macroscopic cross-section, Sigma (r), for
the~al neutron capture in the borehole environment. They have been used to examine
formation waters behind casing and monitor production and depletion behavior of
hydrocarbon reservoirs.
Pulsed neutron capture (PNC) logging was initially developed to measure the
parameter Sigma (27) (Youmans et al., 1964). This macroscopic cross-section of the
absorption of thermal neutrons, I7, is a basic physical parameter of the formation
surrounding the logging instrument. As such, the Z-value is a function of the chemical
composition of the rocks and the amount, type, and composition of the fluids present in
the pore space.
Inasmuch as the Z-values in shale formations can be determined by observing
the thermal neutron die-away in the formation, following a burst of neutrons from a