
Page 166 - Origin and Prediction of Abnormal Formation Pressures
P. 166
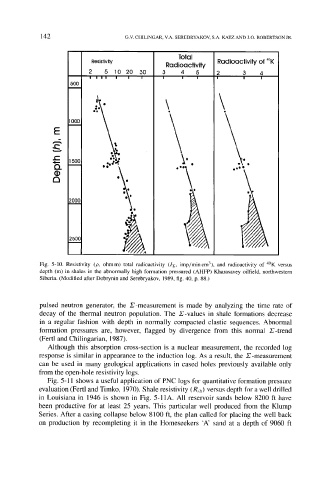
142                     G.V. CHILINGAR, V.A. SEREBRYAKOV, S.A. KATZ AND J.O. ROBERTSON JR.


                                                    Total
                           Resistivity          Radioactivity   Radioactivity  of 4~
                          2    5   ]0  2O  30   3    4   5     2      3    4
                     500   I   l  I  I   I   I   I   '   I   I   I   I   I   I


                                                                 Q
                     1000
                E


                w
                t-"   1500      o;Ao
                ,4,.=-        o ~,1"r
                o.                                 O  o            O 9149
                                                                       9
                (D
                     2000          e'~,

                                     "li
                                      O


            Fig.  5-10.  Resistivity  (p,  ohmm)  total  radioactivity  (lr~,  imp/mincm3),  and  radioactivity  of  4~  versus
            depth  (m)  in  shales  in  the  abnormally  high  formation  pressured  (AHFP)  Kharasavey  oilfield,  northwestern
            Siberia.  (Modified after Dobrynin and  Serebryakov,  1989, fig. 40,  p.  88.)


            pulsed  neutron  generator,  the  Z'-measurement  is  made  by  analyzing  the  time  rate  of
            decay  of  the  thermal  neutron  population.  The  E-values  in  shale  formations  decrease
            in  a  regular  fashion  with  depth  in  normally  compacted  clastic  sequences.  Abnormal
            formation  pressures  are,  however,  flagged  by  divergence  from  this  normal  Z-trend
            (Fertl and Chilingarian,  1987).
               Although  this  absorption  cross-section  is  a  nuclear  measurement,  the  recorded  log
            response  is  similar in  appearance  to the  induction  log.  As  a result,  the  r-measurement
            can  be  used  in  many  geological  applications  in  cased  holes  previously  available  only
            from the open-hole  resistivity logs.
               Fig.  5-11  shows  a useful  application  of PNC  logs  for quantitative  formation pressure
            evaluation (Fertl and Timko,  1970).  Shale resistivity (R~h) versus depth for a well drilled
            in  Louisiana  in  1946  is  shown  in  Fig.  5-11A.  All  reservoir  sands  below  8200  ft  have
            been  productive  for  at  least  25  years.  This  particular  well  produced  from  the  Klump
            Series.  After  a  casing  collapse  below  8100  ft,  the  plan  called for placing  the  well back
            on  production  by  recompleting  it  in  the  Homeseekers  'A'  sand  at  a  depth  of  9060  ft