
Page 161 - Origin and Prediction of Abnormal Formation Pressures
P. 161
METHODS OF ESTIMATING AND PREDICTING ABNORMAL FORMATION PRESSURES 137
Log X
B\ A
hi
aZZ
r i\\
h2 I
S J
2o 2~
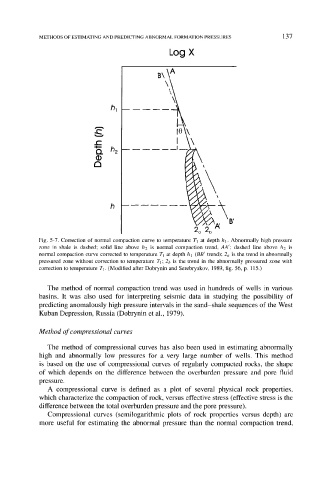
Fig. 5-7. Correction of normal compaction curve to temperature T1 at depth hi. Abnormally high pressure
zone in shale is dashed; solid line above h2 is normal compaction trend, AAt; dashed line above h2 is
normal compaction curve corrected to temperature Tt at depth h 1 (BB ~ trend); 2a is the trend in abnormally
pressured zone without correction to temperature T1; 2b is the trend in the abnormally pressured zone with
correction to temperature T1. (Modified after Dobrynin and Serebryakov, 1989, fig. 56, p. 115.)
The method of normal compaction trend was used in hundreds of wells in various
basins. It was also used for interpreting seismic data in studying the possibility of
predicting anomalously high pressure intervals in the sand-shale sequences of the West
Kuban Depression, Russia (Dobrynin et al., 1979).
Method of compressional curves
The method of compressional curves has also been used in estimating abnormally
high and abnormally low pressures for a very large number of wells. This method
is based on the use of compressional curves of regularly compacted rocks, the shape
of which depends on the difference between the overburden pressure and pore fluid
pressure.
A compressional curve is defined as a plot of several physical rock properties,
which characterize the compaction of rock, versus effective stress (effective stress is the
difference between the total overburden pressure and the pore pressure).
Compressional curves (semilogarithmic plots of rock properties versus depth) are
more useful for estimating the abnormal pressure than the normal compaction trend,