Page 163 - Origin and Prediction of Abnormal Formation Pressures
P. 163

METHODS  OF ESTIMATING  AND  PREDICTING  ABNORMAL  FORMATION  PRESSURES   139

                                           n x (slope)


                                   .05~ -.o56
                 .054              .----'.05  -
                                   -----'----'.04
                                                        .033o
                               ,035
                                          .029       9
                                               , .025

                                  ~.0~      .033  . . . .   ~5~
                                                         .04


                                                      [intercept]


                   \
                                         . I  ~      "35  9


                         9
                                     9                        q,.
                                 e'[4      ~   -.01~ ~   20211,/   /
                                                             -.22


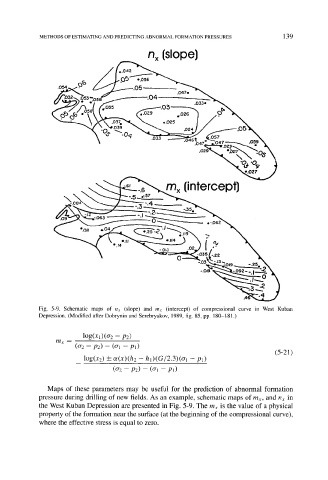
            Fig.  5-9.  Schematic  maps  of  nx  (slope)  and  mx  (intercept)  of  compressional  curve  in  West  Kuban
            Depression. (Modified after Dobrynin and Serebryakov, 1989, fig. 85, pp.  180-181.)

                         log(xl)(o-2  -  P2)
                 mx   -   (o-2 -  P2)  -  (o-1 -  Pl)
                                                                               (5-21)
                         log(x2)  •  ol(x)(h2  --  hI)(G/2.3)(o-I   -  Pl)
                                 (o-2 --  P2)  --  (o-1   Pl)


               Maps  of  these  parameters  may  be  useful  for  the  prediction  of  abnormal  formation
            pressure  during  drilling  of new  fields.  As  an  example,  schematic  maps  of mx,  and  nx  in
            the  West  Kuban  Depression  are presented  in Fig.  5-9.  The  mx  is  the  value  of a  physical
            property  of the formation  near the  surface  (at the beginning  of the  compressional  curve),
            where  the effective stress  is equal  to zero.
   158   159   160   161   162   163   164   165   166   167   168