
Page 63 - Origin and Prediction of Abnormal Formation Pressures
P. 63
46 G.V. CHILINGAR, J.O. ROBERTSON JR. AND H.H. RIEKE III
2.6
A
, ..'-( .. . ,~...>7. . . . . 9
.. ..#/.,~?:.' ,.....: : .
2.4
E
O
2.2
/
/
C 2.0 /
d~ /
L3 / /
/
1.8 ! !
/
/
/
1.6 I /
I
1.4 i I I I i , I I i i i I
1000 3000 5000
Depth at Garber (O), It
~ 5o
--O- \
w
.,~ 4o % B
' %
%
%
%
o 30 % %
O %
IX.
C 20
O
.=u.
.@,m
O l0
E
O 0 I i l i i i
i1_
0 2000 4000 6000
Depth (O), ft
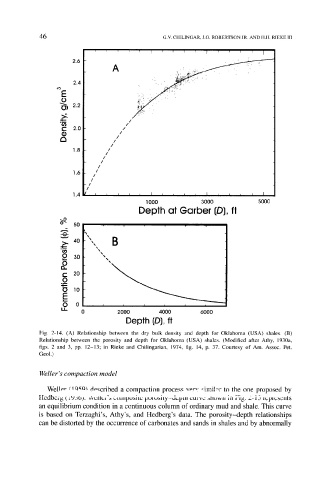
Fig. 2-14. (A) Relationship between the dry bulk density and depth for Oklahoma (USA) shales. (B)
Relationship between the porosity and depth for Oklahoma (USA) shales. (Modified after Athy, 1930a,
figs. 2 and 3, pp. 12-13; in Rieke and Chilingarian, 1974, fig. 14, p. 37. Courtesy of Am. Assoc. Pet.
Geol.)
Weller's compaction model
Wello," cloCaa described a compaction process ,,or,, ~imil,r to the one proposed by
Ilcdbci~; (lPJo). ,Vcllt~i'a cuJ,Jpuaitc pu~uaity-dvpm cmvc ~llu'~vn in Fig. 2-i5 lcplcSClitS
an equilibrium condition in a continuous column of ordinary mud and shale. This curve
is based on Terzaghi's, Athy's, and Hedberg's data. The porosity-depth relationships
can be distorted by the occurrence of carbonates and sands in shales and by abnormally