
Page 58 - Origin and Prediction of Abnormal Formation Pressures
P. 58
ORIGIN OF ABNORMAL FORMATION PRESSURES 41
0 500 100o ] 500
I KG/CM2
I
" \',\,\\
500
Q
-1- 1000
I--
ILl
c~
\\\\\
I i ii ~.k~-,~ IMPERMEABLE CAPROCK
1500
- -- ~\\\
2000 Ib 600 m
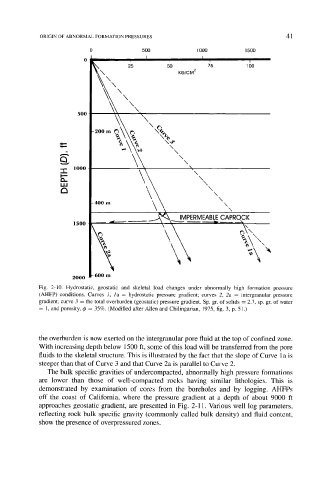
Fig. 2-10. Hydrostatic, geostatic and skeletal load changes under abnormally high formation pressure
(AHFP) conditions. Curves 1, la = hydrostatic pressure gradient; curves 2, 2a = intergranular pressure
gradient; curve 3 = the total overburden (geostatic) pressure gradient. Sp. gr. of solids = 2.7, sp. gr. of water
= 1, and porosity, 4) = 35%. (Modified after Allen and Chilingarian, 1975, fig. 3, p. 51.)
the overburden is now exerted on the intergranular pore fluid at the top of confined zone.
With increasing depth below 1500 ft, some of this load will be transferred from the pore
fluids to the skeletal structure. This is illustrated by the fact that the slope of Curve 1 a is
steeper than that of Curve 3 and that Curve 2a is parallel to Curve 2.
The bulk specific gravities of undercompacted, abnormally high pressure formations
are lower than those of well-compacted rocks having similar lithologies. This is
demonstrated by examination of cores from the boreholes and by logging. AHFPs
off the coast of California, where the pressure gradient at a depth of about 9000 ft
approaches geostatic gradient, are presented in Fig. 2-11. Various well log parameters,
reflecting rock bulk specific gravity (commonly called bulk density) and fluid content,
show the presence of overpressured zones.