
Page 55 - Origin and Prediction of Abnormal Formation Pressures
P. 55
38 G.V. CHILINGAR, J.O. ROBERTSON JR. AND H.H. RIEKE III
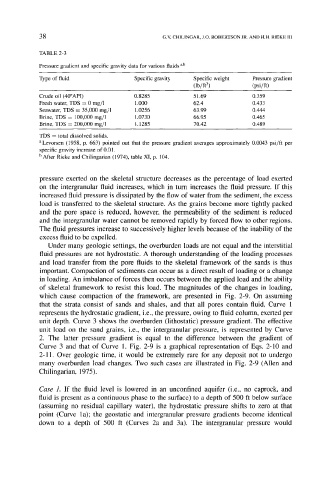
TABLE 2-3
Pressure gradient and specific gravity data for various fluids a,b
Type of fluid Specific gravity Specific weight Pressure gradient
(lb/ft 3) (psi/ft)
Crude oil (40~ 0.8285 51.69 0.359
Fresh water, TDS = 0 mg/1 1.000 62.4 0.433
Seawater, TDS = 35,000 mg/l 1.0256 63.99 0.444
Brine, TDS = 100,000 mg/1 1.0730 66.95 0.465
Brine, TDS = 200,000 mg/1 1.1285 70.42 0.489
TDS -- total dissolved solids.
a Levorsen (1958, p. 663) pointed out that the pressure gradient averages approximately 0.0043 psi/ft per
specific gravity increase of 0.01.
b After Rieke and Chilingarian (1974), table XI, p. 104.
pressure exerted on the skeletal structure decreases as the percentage of load exerted
on the intergranular fluid increases, which in turn increases the fluid pressure. If this
increased fluid pressure is dissipated by the flow of water from the sediment, the excess
load is transferred to the skeletal structure. As the grains become more tightly packed
and the pore space is reduced, however, the permeability of the sediment is reduced
and the intergranular water cannot be removed rapidly by forced flow to other regions.
The fluid pressures increase to successively higher levels because of the inability of the
excess fluid to be expelled.
Under many geologic settings, the overburden loads are not equal and the interstitial
fluid pressures are not hydrostatic. A thorough understanding of the loading processes
and load transfer from the pore fluids to the skeletal framework of the sands is thus
important. Compaction of sediments can occur as a direct result of loading or a change
in loading. An imbalance of forces then occurs between the applied load and the ability
of skeletal framework to resist this load. The magnitudes of the changes in loading,
which cause compaction of the framework, are presented in Fig. 2-9. On assuming
that the strata consist of sands and shales, and that all pores contain fluid, Curve 1
represents the hydrostatic gradient, i.e., the pressure, owing to fluid column, exerted per
unit depth. Curve 3 shows the overburden (lithostatic) pressure gradient. The effective
unit load on the sand grains, i.e., the intergranular pressure, is represented by Curve
2. The latter pressure gradient is equal to the difference between the gradient of
Curve 3 and that of Curve 1. Fig. 2-9 is a graphical representation of Eqs. 2-10 and
2-11. Over geologic time, it would be extremely rare for any deposit not to undergo
many overburden load changes. Two such cases are illustrated in Fig. 2-9 (Allen and
Chilingarian, 1975).
Case 1. If the fluid level is lowered in an unconfined aquifer (i.e., no caprock, and
fluid is present as a continuous phase to the surface) to a depth of 500 ft below surface
(assuming no residual capillary water), the hydrostatic pressure shifts to zero at that
point (Curve la); the geostatic and intergranular pressure gradients become identical
down to a depth of 500 ft (Curves 2a and 3a). The intergranular pressure would