Page 57 - Origin and Prediction of Abnormal Formation Pressures
P. 57

40                                 G.V. CHILINGAR, J.O. ROBERTSON JR. AND H.H. RIEKE III
                                            PRESSURE, psi
                              0            500          1000          1500
                            0.[         I   I    l       I  I        I  IIli~
                              ~\       25        50        75       1 O0
                              I~\                  Kg/Sq cm
                              I   \\ '~  /   0.77 psi/ft or O. 18 kg/sq cm/m


                           500' =   '"   "-~  ,
                              k   "  '~,  '~,Xx\ -   Total overburden pressure gradient ~'
                              |\    \\  \ \  \   I,'/70.91 si/ftorO.21 kg/sqcm/m
                                                       p
                              ~.200m   ~\  ~\\\  /  /
                              ~\     ~\\~  \  \~.X\/     Unconfined &
                               ~\
                                     ~_\'~  \  \\\\\  unconsolidated
                              !  ~\   ~,..'\'~ \   ', X_    Aquifer
                          ,ooo,:              \  ",),
                              ,  Nydrostatic pressure gradient~ ~   s,,,\ ~ V'.~.
                                                         \
                      E         0.43 psi/ft or O. I kg/sq cm/m \~,   ~_~ ,, \~'~
                                   '/
                              " OOm    \                     ,,,
                          15oo' ,  /     _~ Impermeable Caprock"xX.

                              '~  ;/  Confined  &   '  \  \  '~   ,ntergranulal Prissure gaden t
                                          \
                                                  '~'
                                                                      r
                                                                       i
                                                     \
                                                         0.4_8 p~si/f) or O. 11 kg/sq cm/m
                               _',
                                                 \
                                                   \
                              ~\\unconsolidated  '\  ~       ~""---~~
                                      aquifer ~    ~  '~  '~          t~,
                          2000, _60~3             ~                  /
                               r                             Curve  2c
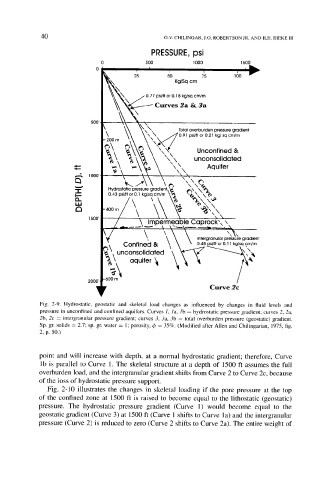
            Fig.  2-9.  Hydrostatic,  geostatic  and  skeletal  load  changes  as  influenced  by  changes  in  fluid  levels  and
            pressure  in  unconfined  and  confined  aquifers.  Curves  1,  la,  lb  --  hydrostatic  pressure  gradient;  curves  2,  2a,
            2b,  2c  --  intergranular  pressure  gradient;  curves  3,  3a,  3b  --  total  overburden  pressure  (geostatic)  gradient.
            Sp.  gr.  solids  --  2.7;  sp.  gr.  water  -  1; porosity,  4) =  35%.  (Modified  after  Allen  and  Chilingarian,  1975,  fig.
            2,  p.  50.)


            point  and  will  increase  with  depth,  at  a  normal  hydrostatic  gradient;  therefore,  Curve
             l b  is  parallel  to  Curve  1.  The  skeletal  structure  at  a  depth  of  1500  ft  assumes  the  full
            overburden load, and the intergranular gradient shifts from Curve 2 to Curve 2c, because
            of the loss of hydrostatic pressure  support.
               Fig.  2-10  illustrates  the  changes  in  skeletal  loading  if  the  pore  pressure  at  the  top
            of the  confined  zone  at  1500  ft  is  raised  to  become  equal  to  the  lithostatic  (geostatic)
            pressure.  The  hydrostatic  pressure  gradient  (Curve  1)  would  become  equal  to  the
            geostatic gradient (Curve 3) at  1500 ft (Curve  1 shifts to Curve  la) and the intergranular
            pressure  (Curve 2) is reduced to zero (Curve 2 shifts to Curve  2a).  The entire weight of
   52   53   54   55   56   57   58   59   60   61   62