
Page 60 - Origin and Prediction of Abnormal Formation Pressures
P. 60
ORIGIN OF ABNORMAL FORMATION PRESSURES 43
POROSITY (~), %
60 50 40 30 20 10 o
0,1
5C
0.5
4,5
E
1.0
c~
30
"1-
2~
0_
LJJ 20
c~
5.0
10.0
] .1 1.5 1.9 2.3 2.7
DENSITY (pJ, g/cm
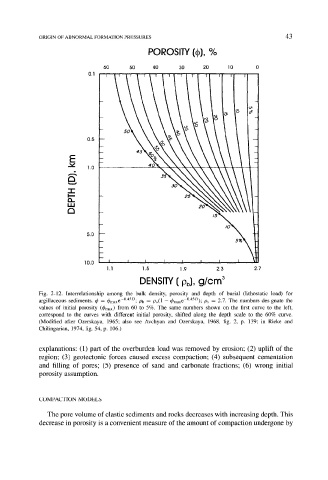
Fig. 2-12. Interrelationship among the bulk density, porosity and depth of burial (lithostatic load) for
argillaceous sediments. 4) = q~maxe-0"45D; jOb -- ps(1 --q~maxe-045D); Ps = 2.7. The numbers des gnate the
values of initial porosity (4~max) from 60 to 5%. The same numbers shown on the first curve to the left,
correspond to the curves with different initial porosity, shifted along the depth scale to the 60% curve.
(Modified after Ozerskaya, 1965; also see Avchyan and Ozerskaya, 1968, fig. 2, p. 139; in Rieke and
Chilingarian, 1974, fig. 54, p. 106.)
explanations: (1) part of the overburden load was removed by erosion; (2) uplift of the
region; (3) geotectonic forces caused excess compaction; (4) subsequent cementation
and filling of pores; (5) presence of sand and carbonate fractions; (6) wrong initial
porosity assumption.
COMPACTION MODEL5
The pore volume of clastic sediments and rocks decreases with increasing depth. This
decrease in porosity is a convenient measure of the amount of compaction undergone by