
Page 56 - Origin and Prediction of Abnormal Formation Pressures
P. 56
ORIGIN OF ABNORMAL FORMATION PRESSURES 39
0 2000 4000 6000 8000 I0,000 12,000 14,000
0
6000
N,--
8000
LLI
10,000
12,000
14,000
~6,OOOl-- I \ \ \ "~,//I///I/I/I/////I/,
~OOO
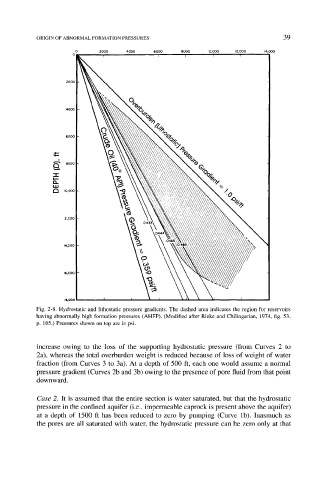
Fig. 2-8. Hydrostatic and lithostatic pressure gradients. The dashed area indicates the region for reservoirs
having abnormally high formation pressures (AHFP). (Modified after Rieke and Chilingarian, 1974, fig. 53,
p. 105.) Pressures shown on top are in psi.
increase owing to the loss of the supporting hydrostatic pressure (from Curves 2 to
2a), whereas the total overburden weight is reduced because of loss of weight of water
fraction (from Curves 3 to 3a). At a depth of 500 ft, each one would assume a normal
pressure gradient (Curves 2b and 3b) owing to the presence of pore fluid from that point
downward.
Case 2. It is assumed that the entire section is water saturated, but that the hydrostatic
pressure in the confined aquifer (i.e., impermeable caprock is present above the aquifer)
at a depth of 1500 ft has been reduced to zero by pumping (Curve lb). Inasmuch as
the pores are all saturated with water, the hydrostatic pressure can be zero only at that