
Page 208 - Orlicky's Material Requirements Planning
P. 208
CHAPTER 10 A New Way of Looking at Things 187
rescheduled, safety stock proves to be “dead” inventory that could be reduced drasti-
cally, if not eliminated.
A FRESH LOOK AT QUEUES
Queue analysis and queue control appear in a new light once the new ability to maintain
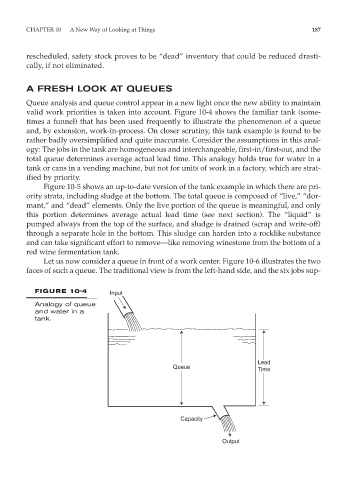
valid work priorities is taken into account. Figure 10-4 shows the familiar tank (some-
times a funnel) that has been used frequently to illustrate the phenomenon of a queue
and, by extension, work-in-process. On closer scrutiny, this tank example is found to be
rather badly oversimplified and quite inaccurate. Consider the assumptions in this anal-
ogy: The jobs in the tank are homogeneous and interchangeable, first-in/first-out, and the
total queue determines average actual lead time. This analogy holds true for water in a
tank or cans in a vending machine, but not for units of work in a factory, which are strat-
ified by priority.
Figure 10-5 shows an up-to-date version of the tank example in which there are pri-
ority strata, including sludge at the bottom. The total queue is composed of “live,” “dor-
mant,” and “dead” elements. Only the live portion of the queue is meaningful, and only
this portion determines average actual lead time (see next section). The “liquid” is
pumped always from the top of the surface, and sludge is drained (scrap and write-off)
through a separate hole in the bottom. This sludge can harden into a rocklike substance
and can take significant effort to remove—like removing winestone from the bottom of a
red wine fermentation tank.
Let us now consider a queue in front of a work center. Figure 10-6 illustrates the two
faces of such a queue. The traditional view is from the left-hand side, and the six jobs sup-
FIGURE 10-4 Input
Analogy of queue
and water in a
tank.
Lead
Queue
Time
Capacity
Output