
Page 453 - Orlicky's Material Requirements Planning
P. 453
CHAPTER 25 Dynamic Buffers 431
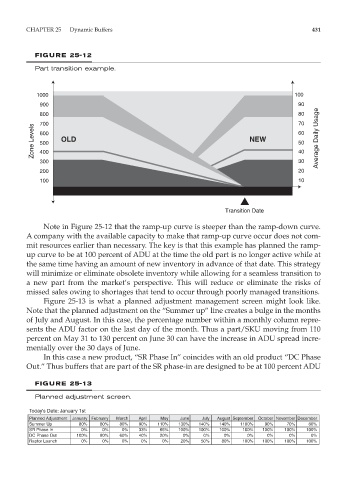
FIGURE 25-12
Part transition example.
1000 100
900 90
800 80
700 70
Zone Levels 600 OLD NEW 60 Average Daily Usage
50
500
40
400
300 30
200 20
100 10
Transition Date
Note in Figure 25-12 that the ramp-up curve is steeper than the ramp-down curve.
A company with the available capacity to make that ramp-up curve occur does not com-
mit resources earlier than necessary. The key is that this example has planned the ramp-
up curve to be at 100 percent of ADU at the time the old part is no longer active while at
the same time having an amount of new inventory in advance of that date. This strategy
will minimize or eliminate obsolete inventory while allowing for a seamless transition to
a new part from the market’s perspective. This will reduce or eliminate the risks of
missed sales owing to shortages that tend to occur through poorly managed transitions.
Figure 25-13 is what a planned adjustment management screen might look like.
Note that the planned adjustment on the “Summer up” line creates a bulge in the months
of July and August. In this case, the percentage number within a monthly column repre-
sents the ADU factor on the last day of the month. Thus a part/SKU moving from 110
percent on May 31 to 130 percent on June 30 can have the increase in ADU spread incre-
mentally over the 30 days of June.
In this case a new product, “SR Phase In” coincides with an old product “DC Phase
Out.” Thus buffers that are part of the SR phase-in are designed to be at 100 percent ADU
FIGURE 25-13
Planned adjustment screen.
Today’s Date: January 1st
Planned Adjustment January February March April May June July August September October November December
Summer Up 80% 80% 80% 90% 110% 130% 140% 140% 1100% 90% 70% 80%
SR Phase In 0% 0% 0% 33% 66% 100% 100% 100% 100% 100% 100% 100%
DC Phase Out 100% 80% 60% 40% 20% 0% 0% 0% 0% 0% 0% 0%
Raptor Launch 0% 0% 0% 0% 0% 20% 50% 80% 100% 100% 100% 100%