Page 452 - Orlicky's Material Requirements Planning
P. 452

430                                                 PART 4      Looking Backward and Forward
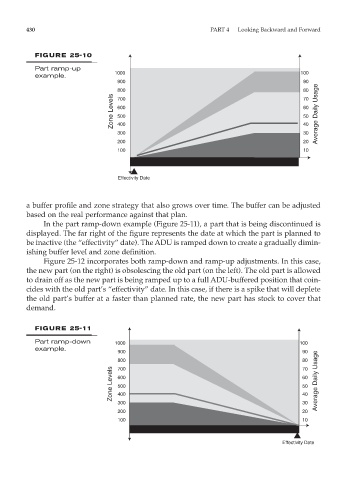

           FIGURE 25-10

           Part ramp-up
                                 1000                                                100
           example.
                                  900                                                 90
                                  800                                                 80
                                Zone Levels  600                                      60 Average Daily Usage
                                  700
                                                                                      70
                                                                                      50
                                  500
                                  400
                                  300                                                 40
                                                                                      30
                                  200                                                 20
                                  100                                                 10


                                  Effectivity Date


        a buffer profile and zone strategy that also grows over time. The buffer can be adjusted
        based on the real performance against that plan.
             In the part ramp-down example (Figure 25-11), a part that is being discontinued is
        displayed. The far right of the figure represents the date at which the part is planned to
        be inactive (the “effectivity” date). The ADU is ramped down to create a gradually dimin-
        ishing buffer level and zone definition.
             Figure 25-12 incorporates both ramp-down and ramp-up adjustments. In this case,
        the new part (on the right) is obsolescing the old part (on the left). The old part is allowed
        to drain off as the new part is being ramped up to a full ADU-buffered position that coin-
        cides with the old part’s “effectivity” date. In this case, if there is a spike that will deplete
        the old part’s buffer at a faster than planned rate, the new part has stock to cover that
        demand.


           FIGURE 25-11
           Part ramp-down        1000                                                100
           example.
                                  900                                                90
                                  800                                                80
                                Zone Levels  600                                     60  Average Daily Usage
                                  700
                                                                                     70
                                                                                     50
                                  500
                                  400
                                                                                     30
                                  300                                                40
                                  200                                                20
                                  100                                                10


                                                                                Effectivity Date
   447   448   449   450   451   452   453   454   455   456   457