
Page 491 - Orlicky's Material Requirements Planning
P. 491
468 PART 4 Looking Backward and Forward
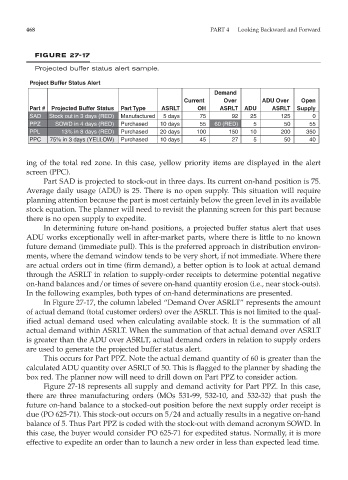
FIGURE 27-17
Projected buffer status alert sample.
Project Buffer Status Alert
Demand
Current Over ADU Over Open
Part # Projected Buffer Status Part Type ASRLT OH ASRLT ADU ASRLT Supply
SAD Stock out in 3 days (RED) Manufactured 5 days 75 92 25 125 0
PPZ SOWD in 4 days (RED) Purchased 10 days 55 60 (RED) 5 50 55
PPL 13% in 8 days (RED) Purchased 20 days 100 150 10 200 350
PPC 75% in 3 days (YELLOW) Purchased 10 days 45 27 5 50 40
ing of the total red zone. In this case, yellow priority items are displayed in the alert
screen (PPC).
Part SAD is projected to stock-out in three days. Its current on-hand position is 75.
Average daily usage (ADU) is 25. There is no open supply. This situation will require
planning attention because the part is most certainly below the green level in its available
stock equation. The planner will need to revisit the planning screen for this part because
there is no open supply to expedite.
In determining future on-hand positions, a projected buffer status alert that uses
ADU works exceptionally well in after-market parts, where there is little to no known
future demand (immediate pull). This is the preferred approach in distribution environ-
ments, where the demand window tends to be very short, if not immediate. Where there
are actual orders out in time (firm demand), a better option is to look at actual demand
through the ASRLT in relation to supply-order receipts to determine potential negative
on-hand balances and/or times of severe on-hand quantity erosion (i.e., near stock-outs).
In the following examples, both types of on-hand determinations are presented.
In Figure 27-17, the column labeled “Demand Over ASRLT” represents the amount
of actual demand (total customer orders) over the ASRLT. This is not limited to the qual-
ified actual demand used when calculating available stock. It is the summation of all
actual demand within ASRLT. When the summation of that actual demand over ASRLT
is greater than the ADU over ASRLT, actual demand orders in relation to supply orders
are used to generate the projected buffer status alert.
This occurs for Part PPZ. Note the actual demand quantity of 60 is greater than the
calculated ADU quantity over ASRLT of 50. This is flagged to the planner by shading the
box red. The planner now will need to drill down on Part PPZ to consider action.
Figure 27-18 represents all supply and demand activity for Part PPZ. In this case,
there are three manufacturing orders (MOs 531-99, 532-10, and 532-32) that push the
future on-hand balance to a stocked-out position before the next supply order receipt is
due (PO 625-71). This stock-out occurs on 5/24 and actually results in a negative on-hand
balance of 5. Thus Part PPZ is coded with the stock-out with demand acronym SOWD. In
this case, the buyer would consider PO 625-71 for expedited status. Normally, it is more
effective to expedite an order than to launch a new order in less than expected lead time.