
Page 139 - PVT Property Correlations
P. 139
116 PVT Property Correlations
knowledge of some surface fluid properties data (e.g., GCR, API of
stock-tank oil, and reservoir temperature). The data available for the
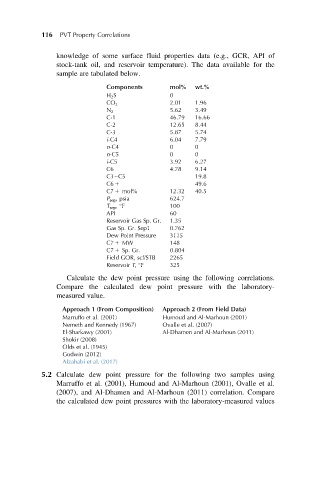
sample are tabulated below.
Components mol% wt.%
H 2 S 0
2.01 1.96
CO 2
N 2 5.62 3.49
C-1 46.79 16.66
C-2 12.65 8.44
C-3 5.87 5.74
i-C4 6.04 7.79
n-C4 0 0
n-C5 0 0
i-C5 3.92 6.27
C6 4.78 9.14
C3 C5 19.8
C6 1 49.6
C7 1 mol% 12.32 40.5
P sep , psia 624.7
T sep , F 100
API 60
Reservoir Gas Sp. Gr. 1.35
Gas Sp. Gr. Sep1 0.762
Dew Point Pressure 3115
C7 1 MW 148
C7 1 Sp. Gr. 0.804
Field GOR, scf/STB 2265
Reservoir T, F 325
Calculate the dew point pressure using the following correlations.
Compare the calculated dew point pressure with the laboratory-
measured value.
Approach 1 (From Composition) Approach 2 (From Field Data)
Marruffo et al. (2001) Humoud and Al-Marhoun (2001)
Nemeth and Kennedy (1967) Ovalle et al. (2007)
El-Sharkawy (2001) Al-Dhamen and Al-Marhoun (2011)
Shokir (2008)
Olds et al. (1945)
Godwin (2012)
Alzahabi et al. (2017)
5.2 Calculate dew point pressure for the following two samples using
Marruffo et al. (2001), Humoud and Al-Marhoun (2001), Ovalle et al.
(2007), and Al-Dhamen and Al-Marhoun (2011) correlation. Compare
the calculated dew point pressures with the laboratory-measured values