
Page 148 - PVT Property Correlations
P. 148
Volatile Oils Chapter | 6 125
Pressure
temperature
R si (Initial producing GOR) R (Initial producing GOR)
si
2 Stages 3 Stages full
T sep and P sep T sep and P sep 1st, 2nd
Gas Sp.Gr Sep. Gas Sp.Gr Sep. 1st, 2nd
ST API ST API
Pb unknown
Pb known
Calculate Pb
Properties:
OFVF
GFVF
R s
R v
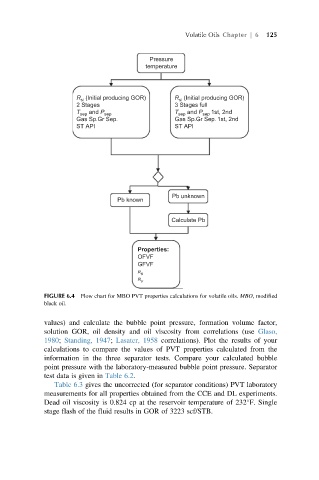
FIGURE 6.4 Flow chart for MBO PVT properties calculations for volatile oils. MBO, modified
black oil.
values) and calculate the bubble point pressure, formation volume factor,
solution GOR, oil density and oil viscosity from correlations (use Glaso,
1980; Standing, 1947; Lasater, 1958 correlations). Plot the results of your
calculations to compare the values of PVT properties calculated from the
information in the three separator tests. Compare your calculated bubble
point pressure with the laboratory-measured bubble point pressure. Separator
test data is given in Table 6.2.
Table 6.3 gives the uncorrected (for separator conditions) PVT laboratory
measurements for all properties obtained from the CCE and DL experiments.
Dead oil viscosity is 0.824 cp at the reservoir temperature of 232 F. Single
stage flash of the fluid results in GOR of 3223 scf/STB.