
Page 166 - PVT Property Correlations
P. 166
140 PVT Property Correlations
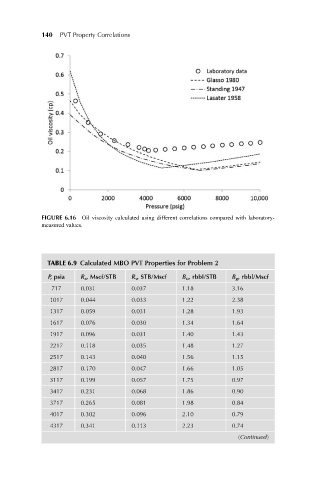
FIGURE 6.16 Oil viscosity calculated using different correlations compared with laboratory-
measured values.
TABLE 6.9 Calculated MBO PVT Properties for Problem 2
P, psia R s , Mscf/STB R v , STB/Mscf B o , rbbl/STB B g , rbbl/Mscf
717 0.031 0.037 1.18 3.16
1017 0.044 0.033 1.22 2.38
1317 0.059 0.031 1.28 1.93
1617 0.076 0.030 1.34 1.64
1917 0.096 0.031 1.40 1.43
2217 0.118 0.035 1.48 1.27
2517 0.143 0.040 1.56 1.15
2817 0.170 0.047 1.66 1.05
3117 0.199 0.057 1.75 0.97
3417 0.231 0.068 1.86 0.90
3717 0.265 0.081 1.98 0.84
4017 0.302 0.096 2.10 0.79
4317 0.341 0.113 2.23 0.74
(Continued)