
Page 161 - PVT Property Correlations
P. 161
Volatile Oils Chapter | 6 135
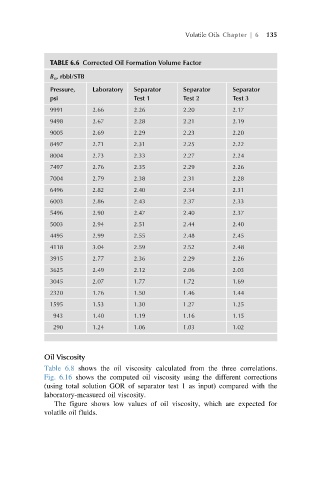
TABLE 6.6 Corrected Oil Formation Volume Factor
B o , rbbl/STB
Pressure, Laboratory Separator Separator Separator
psi Test 1 Test 2 Test 3
9991 2.66 2.26 2.20 2.17
9498 2.67 2.28 2.21 2.19
9005 2.69 2.29 2.23 2.20
8497 2.71 2.31 2.25 2.22
8004 2.73 2.33 2.27 2.24
7497 2.76 2.35 2.29 2.26
7004 2.79 2.38 2.31 2.28
6496 2.82 2.40 2.34 2.31
6003 2.86 2.43 2.37 2.33
5496 2.90 2.47 2.40 2.37
5003 2.94 2.51 2.44 2.40
4495 2.99 2.55 2.48 2.45
4118 3.04 2.59 2.52 2.48
3915 2.77 2.36 2.29 2.26
3625 2.49 2.12 2.06 2.03
3045 2.07 1.77 1.72 1.69
2320 1.76 1.50 1.46 1.44
1595 1.53 1.30 1.27 1.25
943 1.40 1.19 1.16 1.15
290 1.24 1.06 1.03 1.02
Oil Viscosity
Table 6.8 shows the oil viscosity calculated from the three correlations.
Fig. 6.16 shows the computed oil viscosity using the different corrections
(using total solution GOR of separator test 1 as input) compared with the
laboratory-measured oil viscosity.
The figure shows low values of oil viscosity, which are expected for
volatile oil fluids.