
Page 165 - PVT Property Correlations
P. 165
Volatile Oils Chapter | 6 139
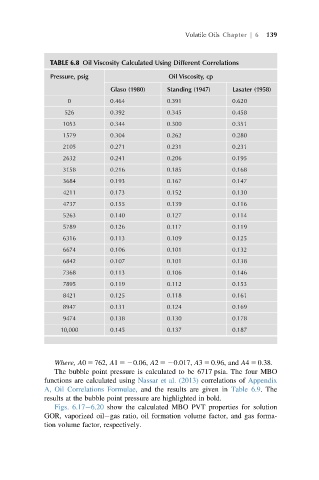
TABLE 6.8 Oil Viscosity Calculated Using Different Correlations
Pressure, psig Oil Viscosity, cp
Glaso (1980) Standing (1947) Lasater (1958)
0 0.464 0.391 0.620
526 0.392 0.345 0.458
1053 0.344 0.300 0.351
1579 0.304 0.262 0.280
2105 0.271 0.231 0.231
2632 0.241 0.206 0.195
3158 0.216 0.185 0.168
3684 0.193 0.167 0.147
4211 0.173 0.152 0.130
4737 0.155 0.139 0.116
5263 0.140 0.127 0.114
5789 0.126 0.117 0.119
6316 0.113 0.109 0.125
6674 0.106 0.101 0.132
6842 0.107 0.101 0.138
7368 0.113 0.106 0.146
7895 0.119 0.112 0.153
8421 0.125 0.118 0.161
8947 0.131 0.124 0.169
9474 0.138 0.130 0.178
10,000 0.145 0.137 0.187
Where, A0 5 762, A1 520.06, A2 520.017, A3 5 0.96, and A4 5 0.38.
The bubble point pressure is calculated to be 6717 psia. The four MBO
functions are calculated using Nassar et al. (2013) correlations of Appendix
A, Oil Correlations Formulae, and the results are given in Table 6.9.The
results at the bubble point pressure are highlighted in bold.
Figs. 6.17 6.20 show the calculated MBO PVT properties for solution
GOR, vaporized oil gas ratio, oil formation volume factor, and gas forma-
tion volume factor, respectively.