
Page 160 - PVT Property Correlations
P. 160
134 PVT Property Correlations
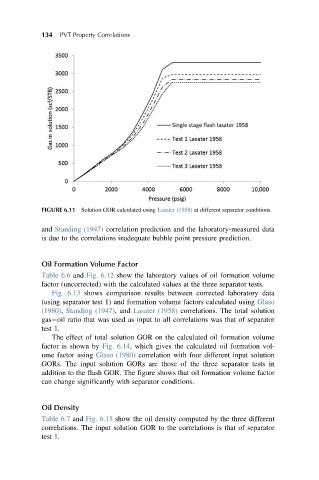
FIGURE 6.11 Solution GOR calculated using Lasater (1958) at different separator conditions.
and Standing (1947) correlation prediction and the laboratory-measured data
is due to the correlations inadequate bubble point pressure prediction.
Oil Formation Volume Factor
Table 6.6 and Fig. 6.12 show the laboratory values of oil formation volume
factor (uncorrected) with the calculated values at the three separator tests.
Fig. 6.13 shows comparison results between corrected laboratory data
(using separator test 1) and formation volume factors calculated using Glaso
(1980), Standing (1947), and Lasater (1958) correlations. The total solution
gas oil ratio that was used as input to all correlations was that of separator
test 1.
The effect of total solution GOR on the calculated oil formation volume
factor is shown by Fig. 6.14, which gives the calculated oil formation vol-
ume factor using Glaso (1980) correlation with four different input solution
GORs. The input solution GORs are those of the three separator tests in
addition to the flash GOR. The figure shows that oil formation volume factor
can change significantly with separator conditions.
Oil Density
Table 6.7 and Fig. 6.15 show the oil density computed by the three different
correlations. The input solution GOR to the correlations is that of separator
test 1.