
Page 157 - PVT Property Correlations
P. 157
Volatile Oils Chapter | 6 131
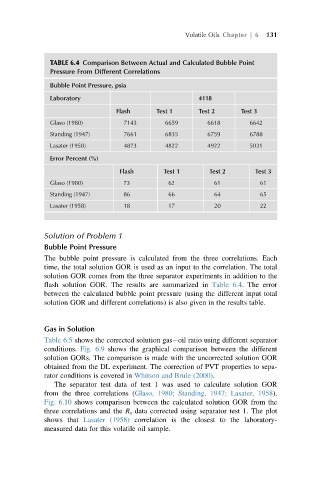
TABLE 6.4 Comparison Between Actual and Calculated Bubble Point
Pressure From Different Correlations
Bubble Point Pressure, psia
Laboratory 4118
Flash Test 1 Test 2 Test 3
Glaso (1980) 7143 6659 6618 6642
Standing (1947) 7661 6835 6759 6788
Lasater (1958) 4873 4822 4922 5031
Error Percent (%)
Flash Test 1 Test 2 Test 3
Glaso (1980) 73 62 61 61
Standing (1947) 86 66 64 65
Lasater (1958) 18 17 20 22
Solution of Problem 1
Bubble Point Pressure
The bubble point pressure is calculated from the three correlations. Each
time, the total solution GOR is used as an input to the correlation. The total
solution GOR comes from the three separator experiments in addition to the
flash solution GOR. The results are summarized in Table 6.4. The error
between the calculated bubble point pressure (using the different input total
solution GOR and different correlations) is also given in the results table.
Gas in Solution
Table 6.5 shows the corrected solution gas oil ratio using different separator
conditions. Fig. 6.9 shows the graphical comparison between the different
solution GORs. The comparison is made with the uncorrected solution GOR
obtained from the DL experiment. The correction of PVT properties to sepa-
rator conditions is covered in Whitson and Brule (2000).
The separator test data of test 1 was used to calculate solution GOR
from the three correlations (Glaso, 1980; Standing, 1947; Lasater, 1958).
Fig. 6.10 shows comparison between the calculated solution GOR from the
three correlations and the R s data corrected using separator test 1. The plot
shows that Lasater (1958) correlation is the closest to the laboratory-
measured data for this volatile oil sample.