
Page 158 - PVT Property Correlations
P. 158
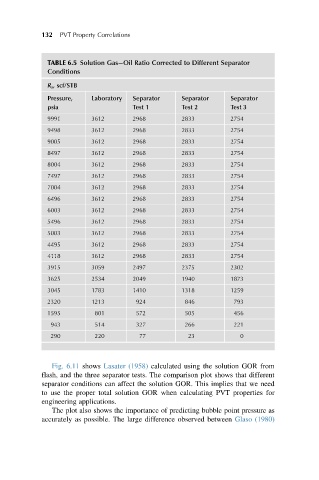
132  PVT Property Correlations


              TABLE 6.5 Solution Gas Oil Ratio Corrected to Different Separator
              Conditions
              R s , scf/STB
              Pressure,   Laboratory  Separator   Separator    Separator
              psia                   Test 1       Test 2       Test 3
              9991        3612       2968         2833         2754
              9498        3612       2968         2833         2754
              9005        3612       2968         2833         2754
              8497        3612       2968         2833         2754
              8004        3612       2968         2833         2754
              7497        3612       2968         2833         2754
              7004        3612       2968         2833         2754
              6496        3612       2968         2833         2754
              6003        3612       2968         2833         2754
              5496        3612       2968         2833         2754
              5003        3612       2968         2833         2754
              4495        3612       2968         2833         2754
              4118        3612       2968         2833         2754
              3915        3059       2497         2375         2302
              3625        2534       2049         1940         1873
              3045        1783       1410         1318         1259
              2320        1213        924          846          793
              1595         801        572          505          456
               943         514        327          266          221
               290         220         77           23            0


               Fig. 6.11 shows Lasater (1958) calculated using the solution GOR from
            flash, and the three separator tests. The comparison plot shows that different
            separator conditions can affect the solution GOR. This implies that we need
            to use the proper total solution GOR when calculating PVT properties for
            engineering applications.
               The plot also shows the importance of predicting bubble point pressure as
            accurately as possible. The large difference observed between Glaso (1980)