
Page 206 - PVT Property Correlations
P. 206
180 PVT Property Correlations
PROBLEMS
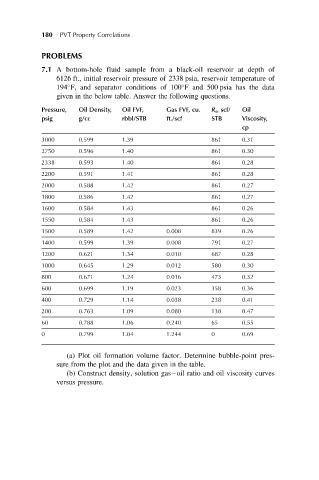
7.1 A bottom-hole fluid sample from a black-oil reservoir at depth of
6126 ft., initial reservoir pressure of 2338 psia, reservoir temperature of
194 F, and separator conditions of 100 F and 500 psia has the data
given in the below table. Answer the following questions.
Pressure, Oil Density, Oil FVF, Gas FVF, cu. R s , scf/ Oil
psig g/cc rbbl/STB ft./scf STB Viscosity,
cp
3000 0.599 1.39 861 0.31
2750 0.596 1.40 861 0.30
2338 0.593 1.40 861 0.28
2200 0.591 1.41 861 0.28
2000 0.588 1.42 861 0.27
1800 0.586 1.42 861 0.27
1600 0.584 1.43 861 0.26
1550 0.584 1.43 861 0.26
1500 0.589 1.42 0.008 839 0.26
1400 0.599 1.39 0.008 791 0.27
1200 0.621 1.34 0.010 687 0.28
1000 0.645 1.29 0.012 580 0.30
800 0.671 1.24 0.016 473 0.32
600 0.699 1.19 0.023 358 0.36
400 0.729 1.14 0.038 238 0.41
200 0.763 1.09 0.080 138 0.47
60 0.788 1.06 0.240 65 0.55
0 0.799 1.04 1.244 0 0.69
(a) Plot oil formation volume factor. Determine bubble-point pres-
sure from the plot and the data given in the table.
(b) Construct density, solution gas oil ratio and oil viscosity curves
versus pressure.