
Page 211 - PVT Property Correlations
P. 211
Low Gas Oil Ratio Oils Chapter | 8 185
FIGURE 8.2 Typical low gas oil ratio oil phase diagram.
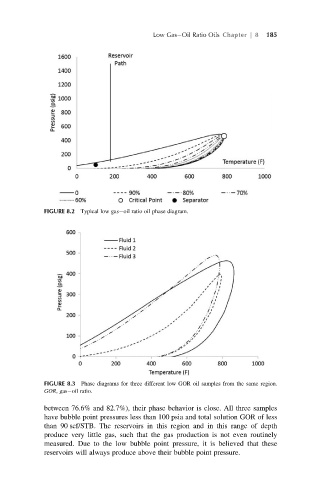
FIGURE 8.3 Phase diagrams for three different low GOR oil samples from the same region.
GOR, gas oil ratio.
between 76.6% and 82.7%), their phase behavior is close. All three samples
have bubble point pressures less than 100 psia and total solution GOR of less
than 90 scf/STB. The reservoirs in this region and in this range of depth
produce very little gas, such that the gas production is not even routinely
measured. Due to the low bubble point pressure, it is believed that these
reservoirs will always produce above their bubble point pressure.