
Page 215 - PVT Property Correlations
P. 215
188 PVT Property Correlations
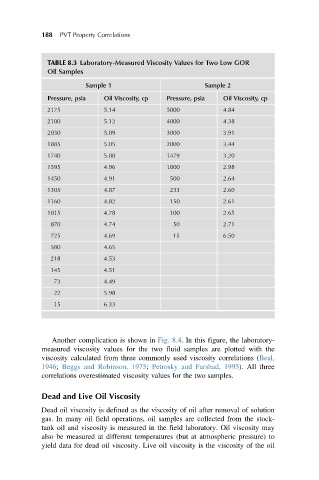
TABLE 8.3 Laboratory-Measured Viscosity Values for Two Low GOR
Oil Samples
Sample 1 Sample 2
Pressure, psia Oil Viscosity, cp Pressure, psia Oil Viscosity, cp
2175 5.14 5000 4.84
2100 5.12 4000 4.38
2030 5.09 3000 3.91
1885 5.05 2000 3.44
1740 5.00 1479 3.20
1595 4.96 1000 2.98
1450 4.91 500 2.64
1305 4.87 233 2.60
1160 4.82 150 2.61
1015 4.78 100 2.65
870 4.74 50 2.71
725 4.69 15 6.50
580 4.65
218 4.53
145 4.51
73 4.49
22 5.98
15 6.33
Another complication is shown in Fig. 8.4. In this figure, the laboratory-
measured viscosity values for the two fluid samples are plotted with the
viscosity calculated from three commonly used viscosity correlations (Beal,
1946; Beggs and Robinson, 1975; Petrosky and Farshad, 1995). All three
correlations overestimated viscosity values for the two samples.
Dead and Live Oil Viscosity
Dead oil viscosity is defined as the viscosity of oil after removal of solution
gas. In many oil field operations, oil samples are collected from the stock-
tank oil and viscosity is measured in the field laboratory. Oil viscosity may
also be measured at different temperatures (but at atmospheric pressure) to
yield data for dead oil viscosity. Live oil viscosity is the viscosity of the oil