
Page 214 - PVT Property Correlations
P. 214
Low Gas Oil Ratio Oils Chapter | 8 187
As shown by these and many other samples, it is evident that low GOR
oils contain low concentrations of C1. In general, C1 mole percent is usually
less than 15% for these oils and C7 1 mole percent is higher than 75%.
PVT PROPERTIES FOR LOW GAS OIL RATIO OILS
The PVT properties required to engineer low GOR oils are the same as those
required for black oils. They also have the same definitions as PVT proper-
ties for black oils. The most challenging PVT property to predict in low
GOR oils is viscosity. The following discussion addresses the issue of oil
viscosity prediction in low GOR oils.
Low Gas Oil Ratio Oil Viscosity
In general, estimation of oil viscosity from correlations poses a challenge with
low GOR oils. Viscosity correlations depend on simple surface data (initial
producing GOR, API gravity of stock-tank oil, specific gravity of separator
gas, and temperature). For many oils, viscosity is strongly correlated with tem-
perature and API gravity of stock-tank oil. However, for low GOR oils, vis-
cosity correlations prove inaccurate in prediction of the actual values. For low
GOR oils, it seems that temperature, solution GOR, and API gravity of stock-
tank oil are inadequate to predict the viscosity. Knowledge of oil composition
requires performance of measurements in a PVT laboratory. The problem of
viscosity prediction by correlation in low GOR oils is illustrated below.
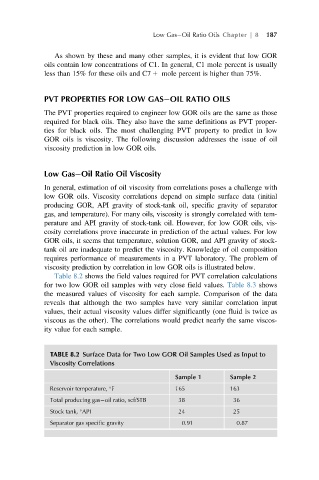
Table 8.2 shows the field values required for PVT correlation calculations
for two low GOR oil samples with very close field values. Table 8.3 shows
the measured values of viscosity for each sample. Comparison of the data
reveals that although the two samples have very similar correlation input
values, their actual viscosity values differ significantly (one fluid is twice as
viscous as the other). The correlations would predict nearly the same viscos-
ity value for each sample.
TABLE 8.2 Surface Data for Two Low GOR Oil Samples Used as Input to
Viscosity Correlations
Sample 1 Sample 2
Reservoir temperature, F 165 163
Total producing gas oil ratio, scf/STB 38 36
Stock tank, API 24 25
Separator gas specific gravity 0.91 0.87