
Page 216 - PVT Property Correlations
P. 216
Low Gas Oil Ratio Oils Chapter | 8 189
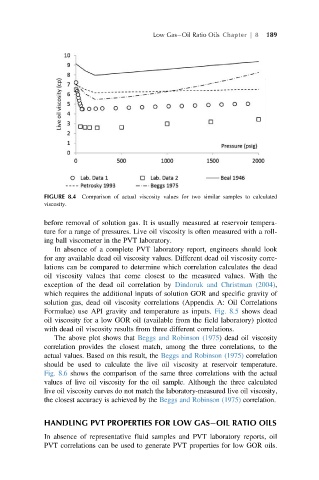
FIGURE 8.4 Comparison of actual viscosity values for two similar samples to calculated
viscosity.
before removal of solution gas. It is usually measured at reservoir tempera-
ture for a range of pressures. Live oil viscosity is often measured with a roll-
ing ball viscometer in the PVT laboratory.
In absence of a complete PVT laboratory report, engineers should look
for any available dead oil viscosity values. Different dead oil viscosity corre-
lations can be compared to determine which correlation calculates the dead
oil viscosity values that come closest to the measured values. With the
exception of the dead oil correlation by Dindoruk and Christman (2004),
which requires the additional inputs of solution GOR and specific gravity of
solution gas, dead oil viscosity correlations (Appendix A: Oil Correlations
Formulae) use API gravity and temperature as inputs. Fig. 8.5 shows dead
oil viscosity for a low GOR oil (available from the field laboratory) plotted
with dead oil viscosity results from three different correlations.
The above plot shows that Beggs and Robinson (1975) dead oil viscosity
correlation provides the closest match, among the three correlations, to the
actual values. Based on this result, the Beggs and Robinson (1975) correlation
should be used to calculate the live oil viscosity at reservoir temperature.
Fig. 8.6 shows the comparison of the same three correlations with the actual
values of live oil viscosity for the oil sample. Although the three calculated
live oil viscosity curves do not match the laboratory-measured live oil viscosity,
the closest accuracy is achieved by the Beggs and Robinson (1975) correlation.
HANDLING PVT PROPERTIES FOR LOW GAS OIL RATIO OILS
In absence of representative fluid samples and PVT laboratory reports, oil
PVT correlations can be used to generate PVT properties for low GOR oils.