
Page 220 - PVT Property Correlations
P. 220
Low Gas Oil Ratio Oils Chapter | 8 193
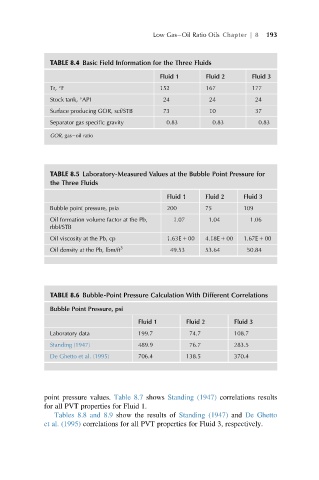
TABLE 8.4 Basic Field Information for the Three Fluids
Fluid 1 Fluid 2 Fluid 3
Tr, F 152 167 177
Stock tank, API 24 24 24
Surface producing GOR, scf/STB 73 10 37
Separator gas specific gravity 0.83 0.83 0.83
GOR, gas oil ratio
TABLE 8.5 Laboratory-Measured Values at the Bubble Point Pressure for
the Three Fluids
Fluid 1 Fluid 2 Fluid 3
Bubble point pressure, psia 200 75 109
Oil formation volume factor at the Pb, 1.07 1.04 1.06
rbbl/STB
Oil viscosity at the Pb, cp 1.63E 1 00 4.18E 1 00 1.67E 1 00
Oil density at the Pb, lbm/ft 3 49.53 53.64 50.84
TABLE 8.6 Bubble-Point Pressure Calculation With Different Correlations
Bubble Point Pressure, psi
Fluid 1 Fluid 2 Fluid 3
Laboratory data 199.7 74.7 108.7
Standing (1947) 489.9 76.7 283.5
De Ghetto et al. (1995) 706.4 138.5 370.4
point pressure values. Table 8.7 shows Standing (1947) correlations results
for all PVT properties for Fluid 1.
Tables 8.8 and 8.9 show the results of Standing (1947) and De Ghetto
et al. (1995) correlations for all PVT properties for Fluid 3, respectively.