
Page 93 - PVT Property Correlations
P. 93
Wet Gases Chapter | 4 71
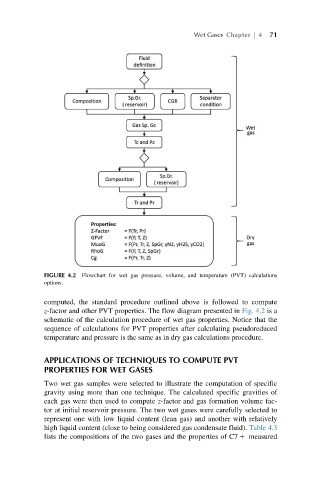
FIGURE 4.2 Flowchart for wet gas pressure, volume, and temperature (PVT) calculations
options.
computed, the standard procedure outlined above is followed to compute
z-factor and other PVT properties. The flow diagram presented in Fig. 4.2 is a
schematic of the calculation procedure of wet gas properties. Notice that the
sequence of calculations for PVT properties after calculating pseudoreduced
temperature and pressure is the same as in dry gas calculations procedure.
APPLICATIONS OF TECHNIQUES TO COMPUTE PVT
PROPERTIES FOR WET GASES
Two wet gas samples were selected to illustrate the computation of specific
gravity using more than one technique. The calculated specific gravities of
each gas were then used to compute z-factor and gas formation volume fac-
tor at initial reservoir pressure. The two wet gases were carefully selected to
represent one with low liquid content (lean gas) and another with relatively
high liquid content (close to being considered gas condensate fluid). Table 4.3
lists the compositions of the two gases and the properties of C7 1 measured