
Page 98 - PVT Property Correlations
P. 98
76 PVT Property Correlations
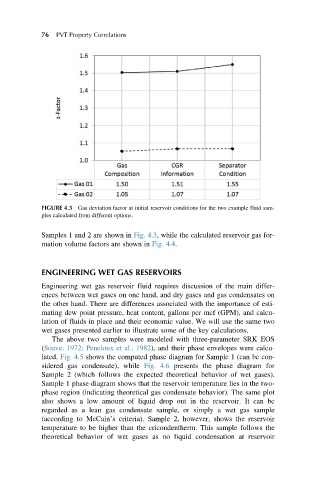
FIGURE 4.3 Gas deviation factor at initial reservoir conditions for the two example fluid sam-
ples calculated from different options.
Samples 1 and 2 are shown in Fig. 4.3, while the calculated reservoir gas for-
mation volume factors are shown in Fig. 4.4.
ENGINEERING WET GAS RESERVOIRS
Engineering wet gas reservoir fluid requires discussion of the main differ-
ences between wet gases on one hand, and dry gases and gas condensates on
the other hand. There are differences associated with the importance of esti-
mating dew point pressure, heat content, gallons per mcf (GPM), and calcu-
lation of fluids in place and their economic value. We will use the same two
wet gases presented earlier to illustrate some of the key calculations.
The above two samples were modeled with three-parameter SRK EOS
(Soave, 1972; Peneloux et al., 1982), and their phase envelopes were calcu-
lated. Fig. 4.5 shows the computed phase diagram for Sample 1 (can be con-
sidered gas condensate), while Fig. 4.6 presents the phase diagram for
Sample 2 (which follows the expected theoretical behavior of wet gases).
Sample 1 phase diagram shows that the reservoir temperature lies in the two-
phase region (indicating theoretical gas condensate behavior). The same plot
also shows a low amount of liquid drop out in the reservoir. It can be
regarded as a lean gas condensate sample, or simply a wet gas sample
(according to McCain’s criteria). Sample 2, however, shows the reservoir
temperature to be higher than the cricondentherm. This sample follows the
theoretical behavior of wet gases as no liquid condensation at reservoir