Page 235 - Packed bed columns for absorption, desorption, rectification and direct heat transfer
P. 235

225


                                              M5
                             • = 037 + 4.5E6 Fr{-"(ad,)~                                    (114)
                           a


                           The influence of Re L is to be neglected. The precision of the experimental
                           constants in this equation is represented in Table 15.
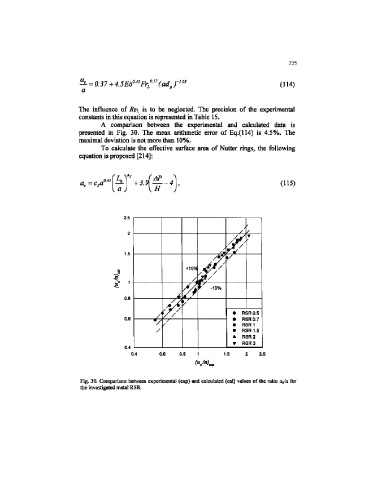
                                  A comparison between the experimental and calculated data is
                           presented in Fig. 30. The mean arithmetic error of Eq.{114) is 4.5%. The
                           maximal deviation is not more than 10%.
                                  To calculate the effective surface area of Nutter rings, the following
                           equation is proposed [214]:


                                                                                            (115)


                                         2,5
                                                                                 /


                                                                          #
                                         1.5


                                                          4'A        -10%
                                                                 \ '
                                         Q.8            /A V
                                                   y0                       •  RSR 0.5

                                         0.8                                •  RSR 0.7
                                                   A   s                    •  RSR1
                                                                            •  RSR 1.5
                                                                            *. RSR 2
                                                                            •  RSR 3
                                         0.4
                                           0.4       0.6   0.8   1       1.5         2.S


                           Fig. 30. Comparison between experimental (exp) and calculated (cal) values of the ratio a/a for
                           the investigated metal RSR.
   230   231   232   233   234   235   236   237   238   239   240