
Page 236 - Packed bed columns for absorption, desorption, rectification and direct heat transfer
P. 236
226
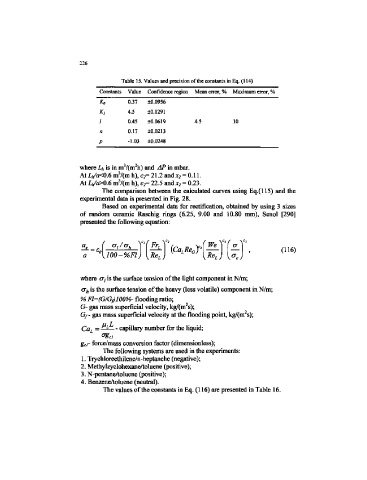
Table 15. Values and precision of the constants in Eq. (114)
Constants Value Confidence region Mean error, % Maximum error, %
0.37 ±0,0956
K, 4.5 ±0.1291
I 0.45 ±0.0619 4.5 10
n 0.17 ±0.0213
P -1.03 ±0.0248
3 2
where Lh is in m /(m h) and AP in mbar.
3
At Li/cKQ.6 m /(m h), CJ= 21.2 and x 2 = 0.11.
3
At V«>0.6 m /(m h), c 2= 22.5 and x 3 = 0.23.
The comparison between the calculated curves using Eq.(llS) and the
experimental data is presented in Fig. 28.
Based on experimental data for rectification, obtained by using 3 sizes
of random ceramic Raschig rings (6.25, 9.00 and 10.80 mm), Senol [290]
presented the following equation:
a
where cr^ is the surface tension of the light component in N/m;
(T h is the surface tension of the heavy (less volatile) component in N/m;
% Fl=(G/Gj}100%- flooding ratio;
2
G- gas mass superficial velocity, kg/(m s);
2
Gj- gas mass superficial velocity at the flooding point, kg/(m s);
Ca L = - capillary number for the liquid;
g cj- force/mass conversion factor (dimensionless);
The following systems are used in the experiments:
1. Trychloreethilene/n-heptanehe (negative);
2, Methylzyclohexane/toluene (positive);
3, N-pentane/toluene (positive);
4. Benzene/toluene (neutral).
The values of the constants in Eq. (116) are presented in Table 16.