
Page 21 - Partition & Adsorption of Organic Contaminants in Environmental Systems
P. 21
12 IMPORTANT THERMODYNAMIC PROPERTIES
TABLE 1.1. Vapor Pressures of Some Liquids as a Function of Temperature a
Vapor Pressure, P° (mmHg)
t (°C) CT TCE TEE BEN o-XYL m-DCB HEX OCT
0 33 21 4.2 1.3 0.4 45 2.8
10 56 36 7.9 44 3.6 0.9 75 5.4
20 91 58 14 73 4.9 1.6 120 10.5
30 143 94 25 120 8.8 3.0 185 17
40 216 140 40 183 15 5.3 275 31
50 317 215 64 273 25 9.0 400 50
60 451 317 97 390 41 15 570 78
70 622 450 145 550 63 24 790 118
80 843 610 207 750 95 37 1050 175
90 840 290 1040 140 56 253
100 400 197 83 354
a CT, carbon tetrachloride; TCE, trichloroethylene; TEE, tetrachloroethylene; BEN, benzene;
o-XYL, o-xylene; m-DCB, m-dichlorobenzene; HEX, n-hexane; OCT, n-octane.
Liquid
mp
Supercooled liquid
Log P
Solid
1/T
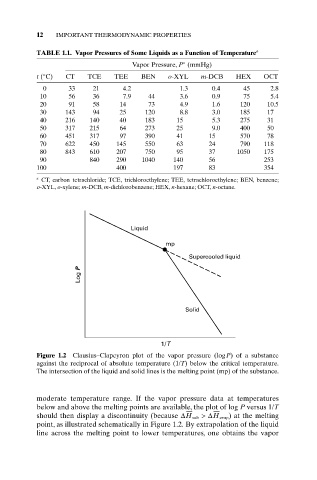
Figure 1.2 Clausius–Clapeyron plot of the vapor pressure (logP) of a substance
against the reciprocal of absolute temperature (1/T) below the critical temperature.
The intersection of the liquid and solid lines is the melting point (mp) of the substance.
moderate temperature range. If the vapor pressure data at temperatures
below and above the melting points are available, the plot of log P versus 1/T
should then display a discontinuity (because DH sub >DH evap) at the melting
point, as illustrated schematically in Figure 1.2. By extrapolation of the liquid
line across the melting point to lower temperatures, one obtains the vapor