
Page 56 -
P. 56
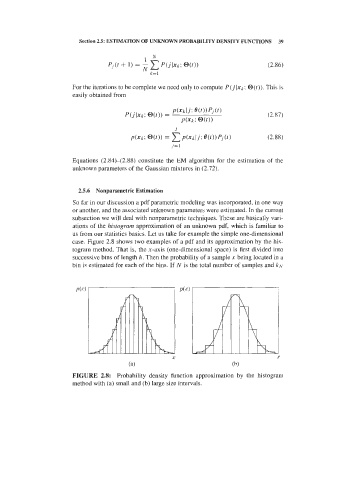
42     2 Pattern Discrimination


          in  many  textbooks  on  Statistics,  namely  Hoe1  (1975).  and  Siegel  and  Castellan
          (1998).


          2.5.1 Graphic Inspection

          Graphic  inspection  allows  one  to  compare  feature  distributions  for  the  several
          classes  of  the  problem  at  hand,  and  therefore  to  obtain  some  insight  into  their
          usefulness  for  the  class  discrimination  task.  There  are  several  types  of  graphic
          representations  that  can  be  used  depending  on  the  insight  one wishes  to  obtain.
          Particularly  useful  in  PR  problems,  besides  histogra~ns, are box  plots  and  scatter
          plots.


              ,800

              two
              4000
            E
               800
               200

              ,200
            a
          Figure 2.18. Box plots  for the 3 classes of cork stopper& and features PRT (a) and
          PRTG  (b):   - median position; I - exfremes,  exceeding above or below  the box
          1.5 times the interquartile distance; o - oufliers, exceeding above or below the box
          3 times the interquartile d~stance.


            A  box  plot  depicts  for  each  feature  and  each  class  a  box  representing  the
          interquartile  range  of  the  distribution,  i.e., covering  50%  of  the  central  feature
          values.  Figure  2.18  shows  box  plots  for  features  PRT  and  PRTG  of  the  cork
          stoppers  data.  As  shown  in  this  figure,  the  box  plot  usually  includes  further
          infonnation.
            As can be appreciated from Figure 2.18, box plots give a clear indication of  the
          discrimination capability  of  each feature and the amount of  overlap of  the  several
          classes. In  this example we  see that  feature PRT seems to discriminate  the  three
          classes  well,  meanwhile  feature  PRTG  seems  to  be  useful  only  in  the
          discrimination of class y from classes wl and  Q.
            Features  with  largely  overlapped distributions are, of  course, of  little help  for
          classification or regression  purposes.