
Page 58 -
P. 58
44 2 Pattern Discrimination
rejected (K-S p < 0.01). In all tests we are using a 95% confidence level. When
using the Kotrzogorov-Stnirnov test one must take into account the Lillefors
correction (use of sample mean and sample variance) as we did before. The
Shapiro-Wilk test results should also be inspected, especially in the situation of
small n (n < 25), where this test is more accurate.
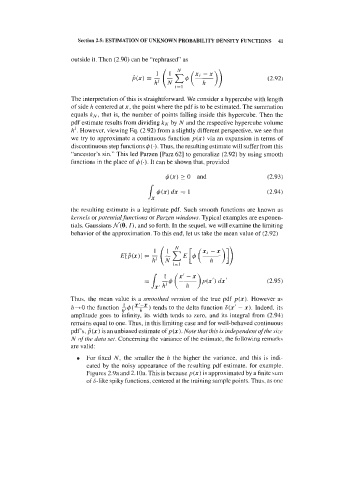
PRT ARTG
K-S dr 07727, p> 20. Llll~elors p> 20 K-S dz 17228 ps 15. L~ll~elors pe 01
Shapir~~VYtlkW= St~a~iro~vV~Ik W= 85457, pc 0000
98596. pc 81 21
22 I . . . . . . . - 1 8 1 . ~ . . . . .
Figure 2.20. Histograms and normality tests for features PRT (a) and ARTG (b).
2.5.3 Statistical Inference Tests
Statistical inference tests provide a quantification of the features' discriminative
powers. The well-known I-Student and Anova statistical tests can be applied to
features complying to a normal distribution, for assessing the discrimination of two
and more than two classes, respectively.
Frequently one has to deal with features showing appreciable departure from the
normal model, at least for some classes. It is also not uncommon to have a reduced
number of cases available at the beginning of a project, thereby decreasing the
power of the normality tests. Therefore, it is reasonable, in many cases, to adopt a
conservative attitude, avoiding the assumption of a distribution model when
comparing features. We then resort to a non-parametric statistical test for
independent samples, namely the Kruskal- Wullis test. Figure 2.2 1 shows the results
of this test for the ART feature of the cork stoppers.
The Kruskal-Wallis test sorts the feature values and assigns ordinal ranks in
corresponding order to the original values. The sums of these ranks for the classes
are then used to compute the value of the governing statistic H, which reflects the
difference of the ranks' sums. From Figure 2.21 we observe a significantly high
(p=O) value of H, not attributable to chance. We therefore accept ART as a feature
with definite discriminating capability.